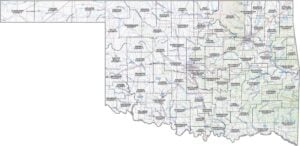
Oklahoma County Map

Oklahoma County Map Collection

We allow you to use our Oklahoma County map. Attribution is required.
Oklahoma County Maps
There are 77 counties in Oklahoma. Check out maps of them all by clicking one below.


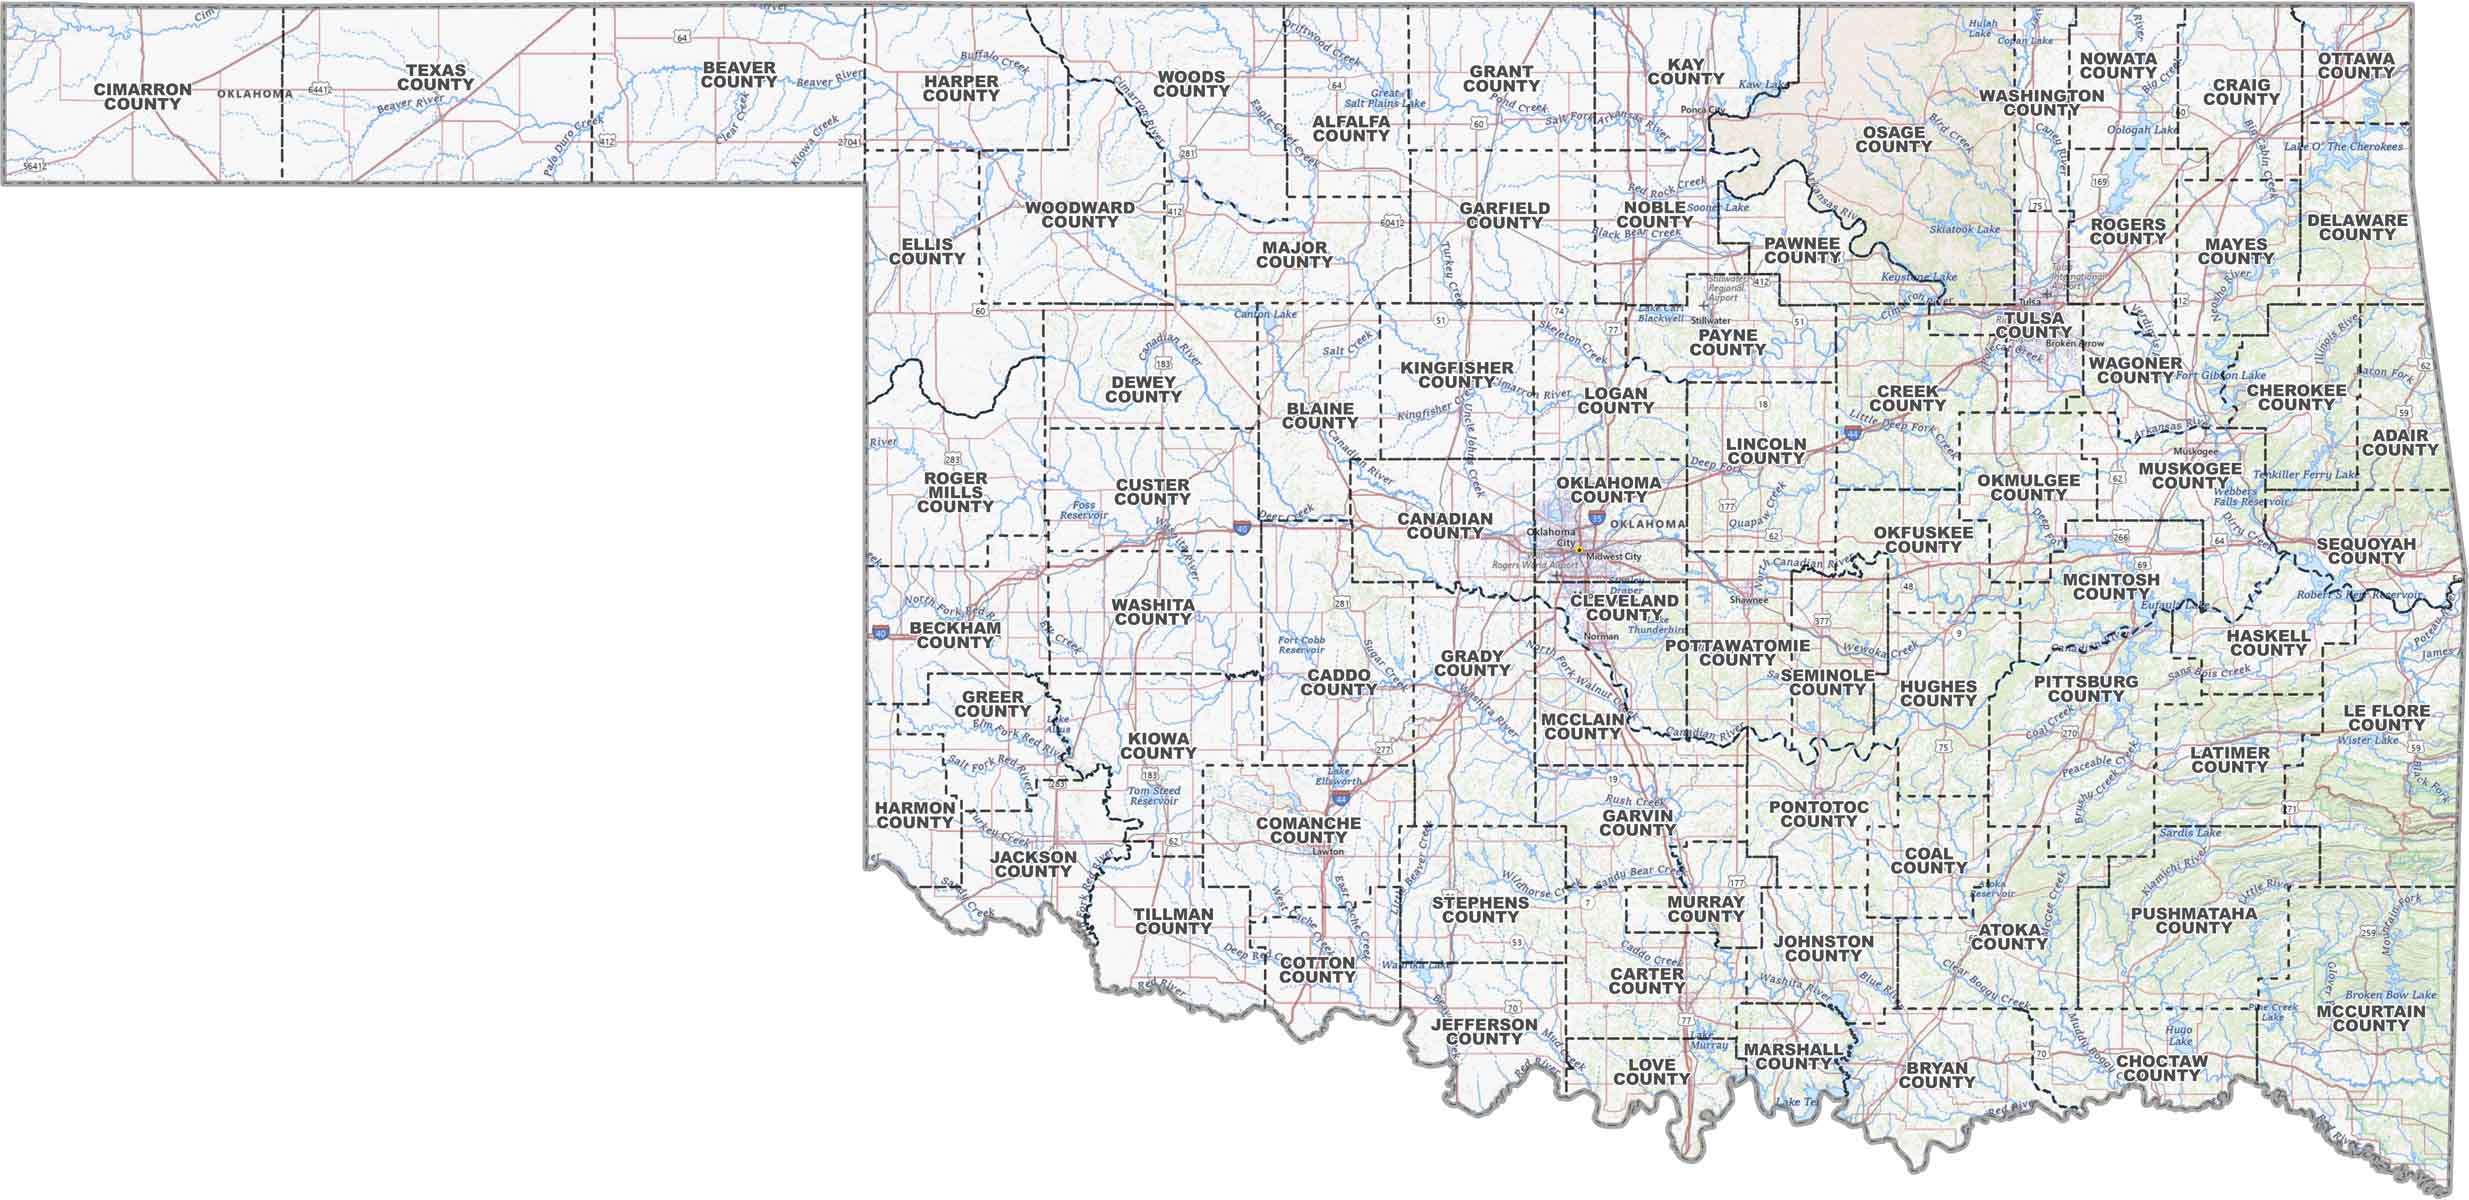
PHYSICAL MAP
Oklahoma Topographic County Map
Our map below lays out Oklahoma in full detail. But the two main features are its county lines and topographic information like roads, lakes, rivers, and cities.
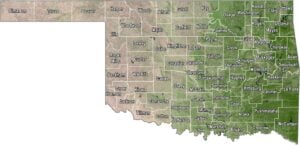
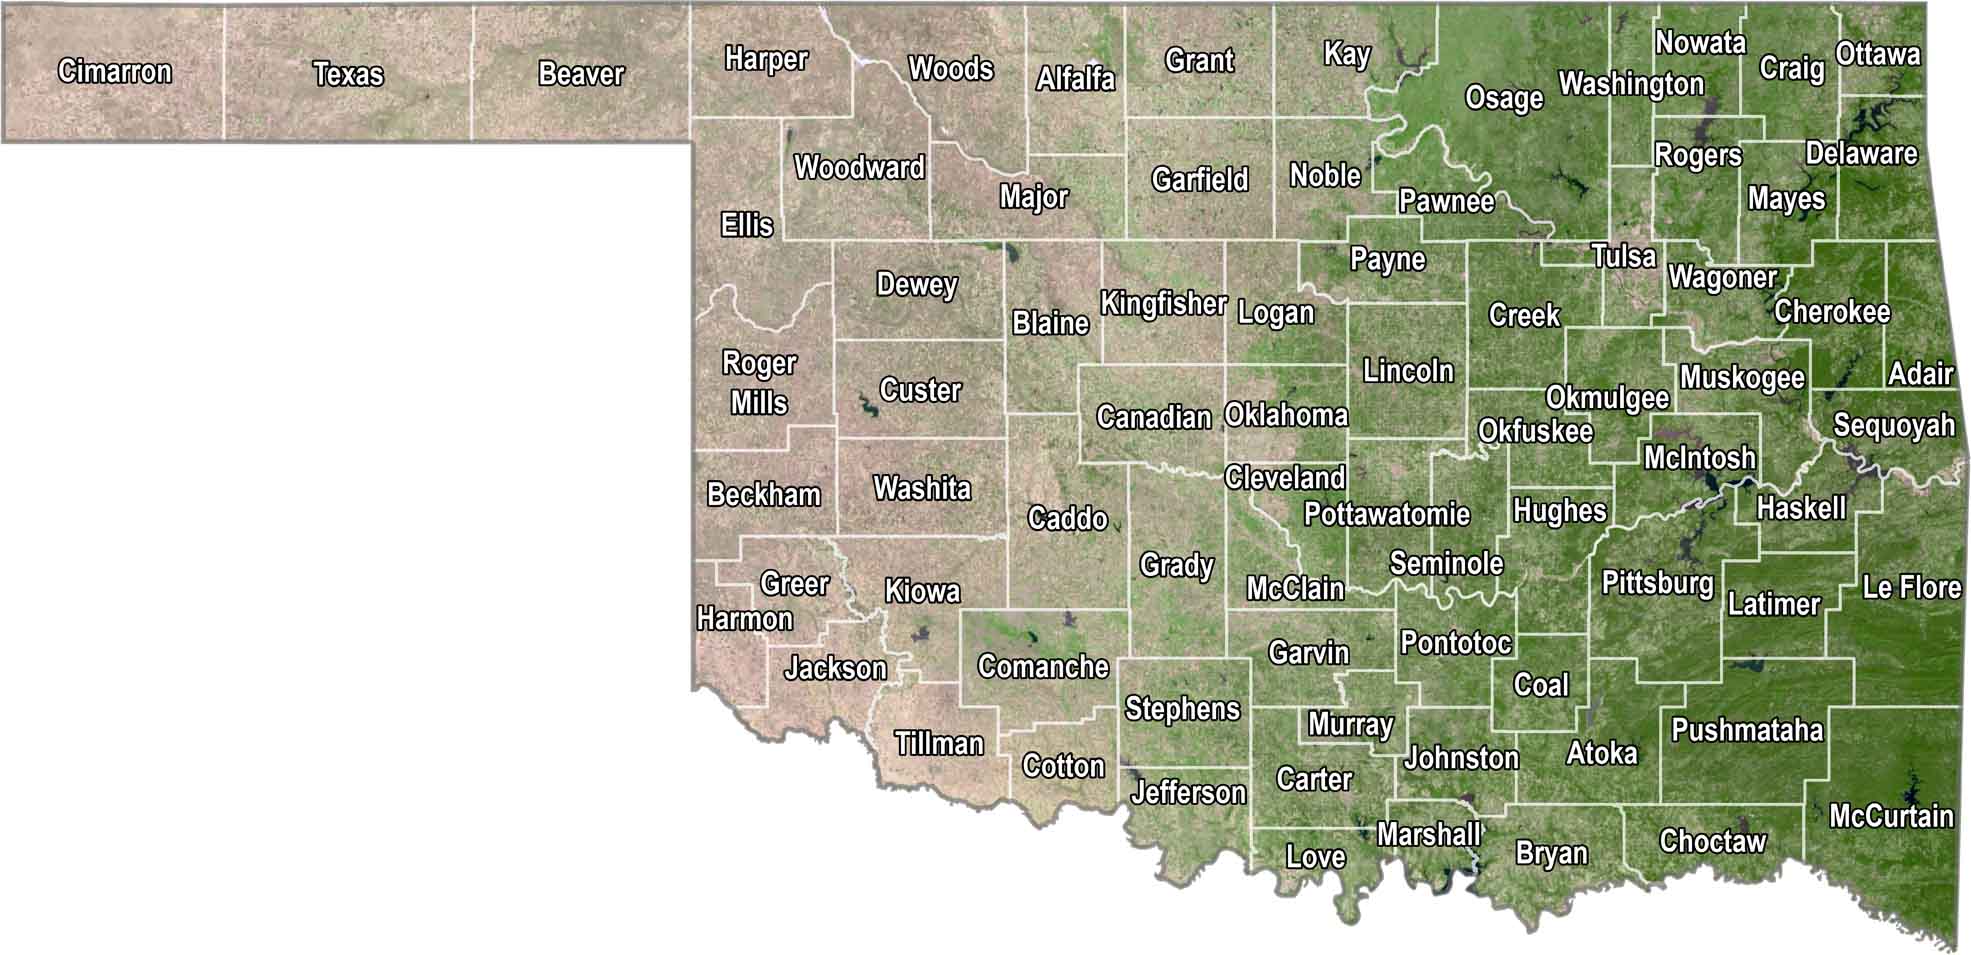
SATELLITE IMAGERY
Oklahoma Satellite County Map
From above, Oklahoma’s all about variety…. Rolling plains, scattered towns, winding rivers, and stretches of green and brown. While the east is green, the west is more of a tan color.
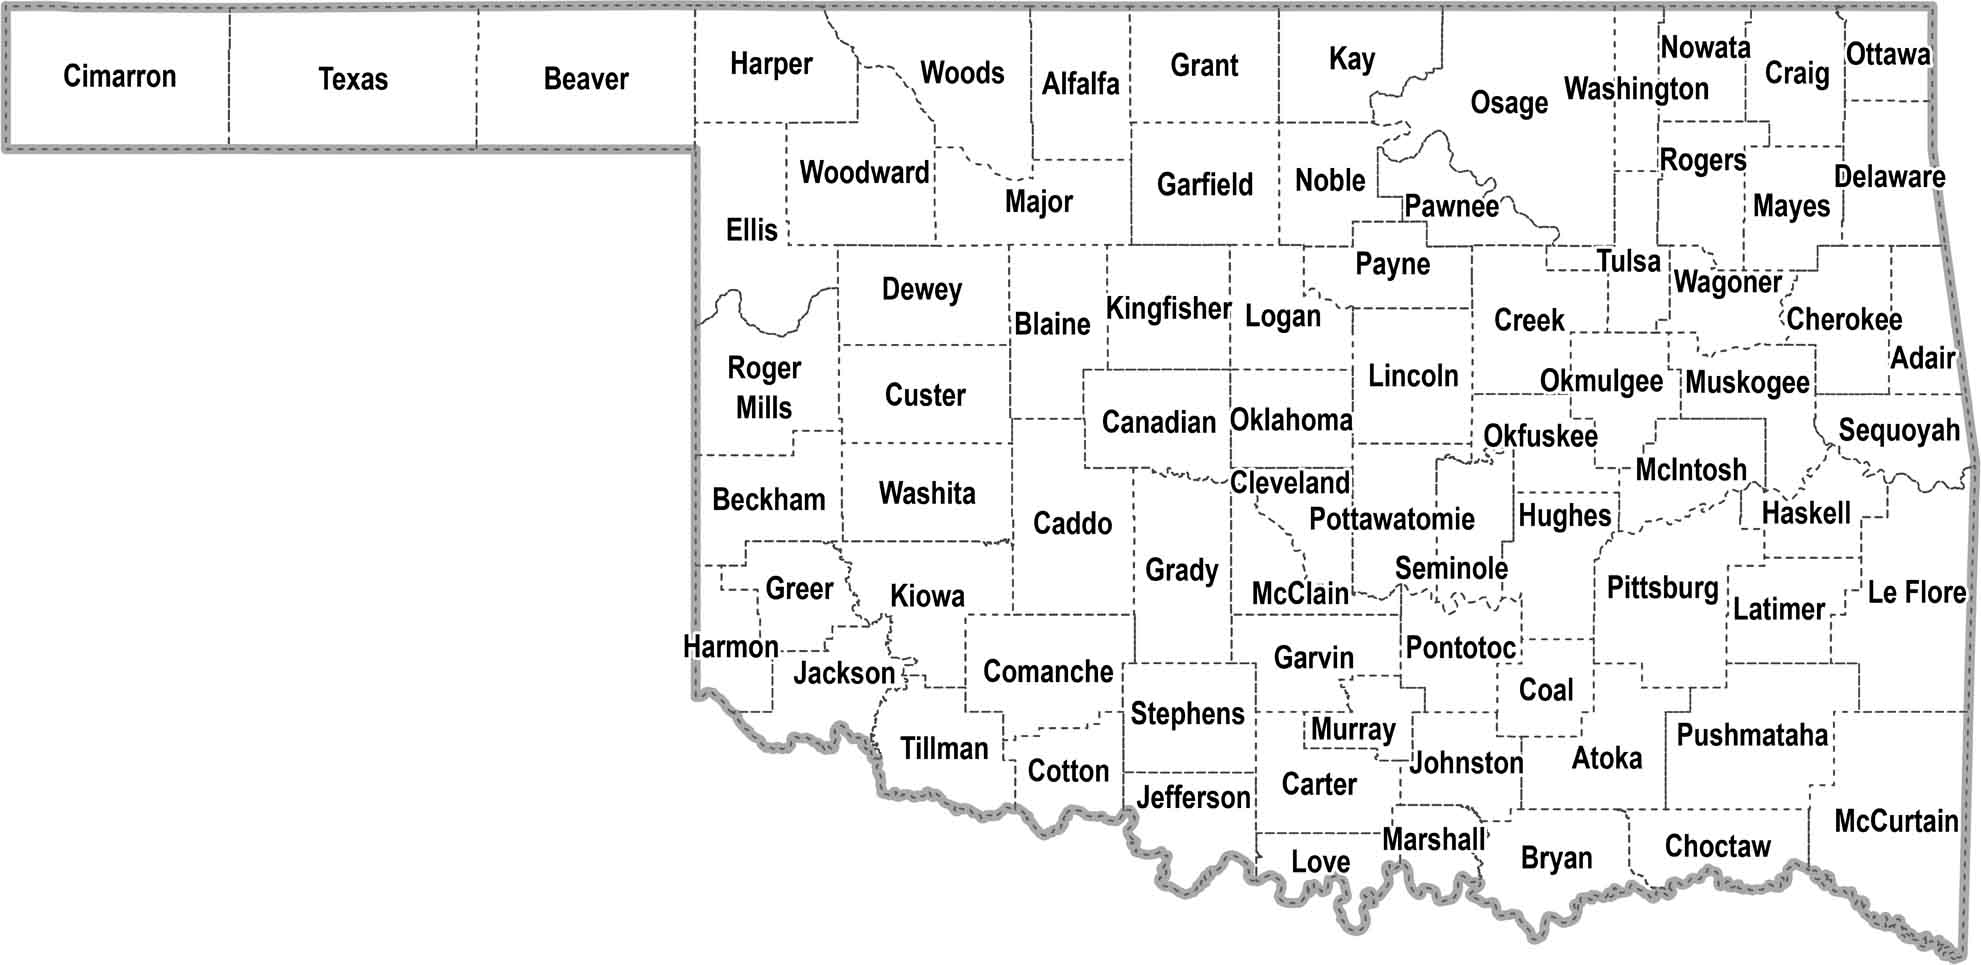
OUTLINE MAP
Oklahoma Simple County Map
Need something straightforward? This map breaks Oklahoma down by county. It’s labeled, easy to read, and in basic black and white.
Oklahoma Counties
In terms of population, Oklahoma County is the most populated here. It’s home to Oklahoma City, the state capital and largest city. As for the least populous, Cimarron County is the emptiest. It’s way out in the panhandle, where the land is dry and the towns are few. You won’t find any big cities there, just wide-open spaces and ranches.
Most Populous: Oklahoma County
Least Populous: Cimarron County

When it comes to size, Osage County is the largest. It’s well over 2,200 square miles in area. A good chunk of it is taken up by the Tallgrass Prairie Preserve. The smallest county in landmass is Marshall County, clocking in at just 371.5 square miles. Almost a quarter of it is covered by Lake Texoma.
Largest Area: Osage County
Smallest Area: Marshall County
Oklahoma’s counties have some quirks. For instance, Sequoyah County is named after the Cherokee who created their writing system. Pretty cool, right? The first county, Oklahoma County, was set up back in 1890 when the area was still a territory. Fun fact: there used to be more counties, but some got merged over time.
Oklahoma County List
See our list below of Oklahoma counties in table format:
| FIPS Code | Name | Land % | Water % | Total Area (sq mi) |
|---|---|---|---|---|
| 40-001 | Adair County | 99.4 | 0.6 | 577.0 |
| 40-003 | Alfalfa County | 98.3 | 1.7 | 881.3 |
| 40-005 | Atoka County | 98.5 | 1.5 | 989.9 |
| 40-007 | Beaver County | 99.8 | 0.2 | 1,817.5 |
| 40-009 | Beckham County | 99.8 | 0.2 | 903.9 |
| 40-011 | Blaine County | 98.9 | 1.1 | 938.8 |
| 40-013 | Bryan County | 95.8 | 4.2 | 943.9 |
| 40-015 | Caddo County | 99.0 | 1.0 | 1,290.2 |
| 40-017 | Canadian County | 99.0 | 1.0 | 905.6 |
| 40-019 | Carter County | 98.6 | 1.4 | 833.8 |
| 40-021 | Cherokee County | 96.5 | 3.5 | 776.3 |
| 40-023 | Choctaw County | 96.3 | 3.7 | 799.6 |
| 40-025 | Cimarron County | 99.7 | 0.3 | 1,840.9 |
| 40-027 | Cleveland County | 96.6 | 3.4 | 558.1 |
| 40-029 | Coal County | 99.1 | 0.9 | 521.3 |
| 40-031 | Comanche County | 98.7 | 1.3 | 1,083.7 |
| 40-033 | Cotton County | 98.6 | 1.4 | 642.0 |
| 40-035 | Craig County | 99.8 | 0.2 | 762.8 |
| 40-037 | Creek County | 98.0 | 2.0 | 969.8 |
| 40-039 | Custer County | 98.7 | 1.3 | 1,002.1 |
| 40-041 | Delaware County | 93.2 | 6.8 | 792.3 |
| 40-043 | Dewey County | 99.1 | 0.9 | 1,008.2 |
| 40-045 | Ellis County | 100.0 | 0.0 | 1,231.9 |
| 40-047 | Garfield County | 99.9 | 0.1 | 1,060.1 |
| 40-049 | Garvin County | 98.6 | 1.4 | 813.7 |
| 40-051 | Grady County | 99.6 | 0.4 | 1,104.9 |
| 40-053 | Grant County | 99.7 | 0.3 | 1,003.6 |
| 40-055 | Greer County | 99.3 | 0.7 | 643.6 |
| 40-057 | Harmon County | 99.7 | 0.3 | 538.7 |
| 40-059 | Harper County | 99.8 | 0.2 | 1,041.0 |
| 40-061 | Haskell County | 92.2 | 7.8 | 625.3 |
| 40-063 | Hughes County | 98.7 | 1.3 | 814.9 |
| 40-065 | Jackson County | 99.8 | 0.2 | 804.2 |
| 40-067 | Jefferson County | 98.0 | 2.0 | 774.1 |
| 40-069 | Johnston County | 97.7 | 2.3 | 658.2 |
| 40-071 | Kay County | 97.3 | 2.7 | 945.0 |
| 40-073 | Kingfisher County | 99.1 | 0.9 | 906.0 |
| 40-075 | Kiowa County | 98.5 | 1.5 | 1,030.7 |
| 40-077 | Latimer County | 99.0 | 1.0 | 729.1 |
| 40-079 | Le Flore County | 98.8 | 1.2 | 1,608.6 |
| 40-081 | Lincoln County | 98.6 | 1.4 | 965.7 |
| 40-083 | Logan County | 99.3 | 0.7 | 748.8 |
| 40-085 | Love County | 96.6 | 3.4 | 532.3 |
| 40-087 | McClain County | 98.4 | 1.6 | 580.3 |
| 40-089 | McCurtain County | 97.3 | 2.7 | 1,902.4 |
| 40-091 | McIntosh County | 86.8 | 13.2 | 712.3 |
| 40-093 | Major County | 99.7 | 0.3 | 957.9 |
| 40-095 | Marshall County | 87.0 | 13.0 | 426.9 |
| 40-097 | Mayes County | 95.9 | 4.1 | 683.5 |
| 40-099 | Murray County | 97.9 | 2.1 | 425.1 |
| 40-101 | Muskogee County | 96.5 | 3.5 | 839.8 |
| 40-103 | Noble County | 98.6 | 1.4 | 742.5 |
| 40-105 | Nowata County | 97.4 | 2.6 | 580.8 |
| 40-107 | Okfuskee County | 98.4 | 1.6 | 628.9 |
| 40-109 | Oklahoma County | 98.7 | 1.3 | 718.4 |
| 40-111 | Okmulgee County | 99.3 | 0.7 | 702.3 |
| 40-113 | Osage County | 97.5 | 2.5 | 2,304.0 |
| 40-115 | Ottawa County | 97.2 | 2.8 | 484.6 |
| 40-117 | Pawnee County | 95.5 | 4.5 | 594.8 |
| 40-119 | Payne County | 98.2 | 1.8 | 697.0 |
| 40-121 | Pittsburg County | 94.7 | 5.3 | 1,377.8 |
| 40-123 | Pontotoc County | 99.3 | 0.7 | 725.2 |
| 40-125 | Pottawatomie County | 99.3 | 0.7 | 793.4 |
| 40-127 | Pushmataha County | 98.1 | 1.9 | 1,422.9 |
| 40-129 | Roger Mills County | 99.5 | 0.5 | 1,146.4 |
| 40-131 | Rogers County | 95.0 | 5.0 | 711.5 |
| 40-133 | Seminole County | 98.8 | 1.2 | 640.5 |
| 40-135 | Sequoyah County | 94.3 | 5.7 | 714.1 |
| 40-137 | Stephens County | 97.6 | 2.4 | 891.4 |
| 40-139 | Texas County | 99.6 | 0.4 | 2,048.7 |
| 40-141 | Tillman County | 99.1 | 0.9 | 879.2 |
| 40-143 | Tulsa County | 97.2 | 2.8 | 587.0 |
| 40-145 | Wagoner County | 95.1 | 4.9 | 590.7 |
| 40-147 | Washington County | 97.9 | 2.1 | 424.3 |
| 40-149 | Washita County | 99.4 | 0.6 | 1,008.8 |
| 40-151 | Woods County | 99.7 | 0.3 | 1,290.0 |
| 40-153 | Woodward County | 99.7 | 0.3 | 1,246.1 |
Source: United States Census Bureau