Illinois County Map

Illinois County Map Collection
We allow you to use our Illinois County map. Attribution is required.
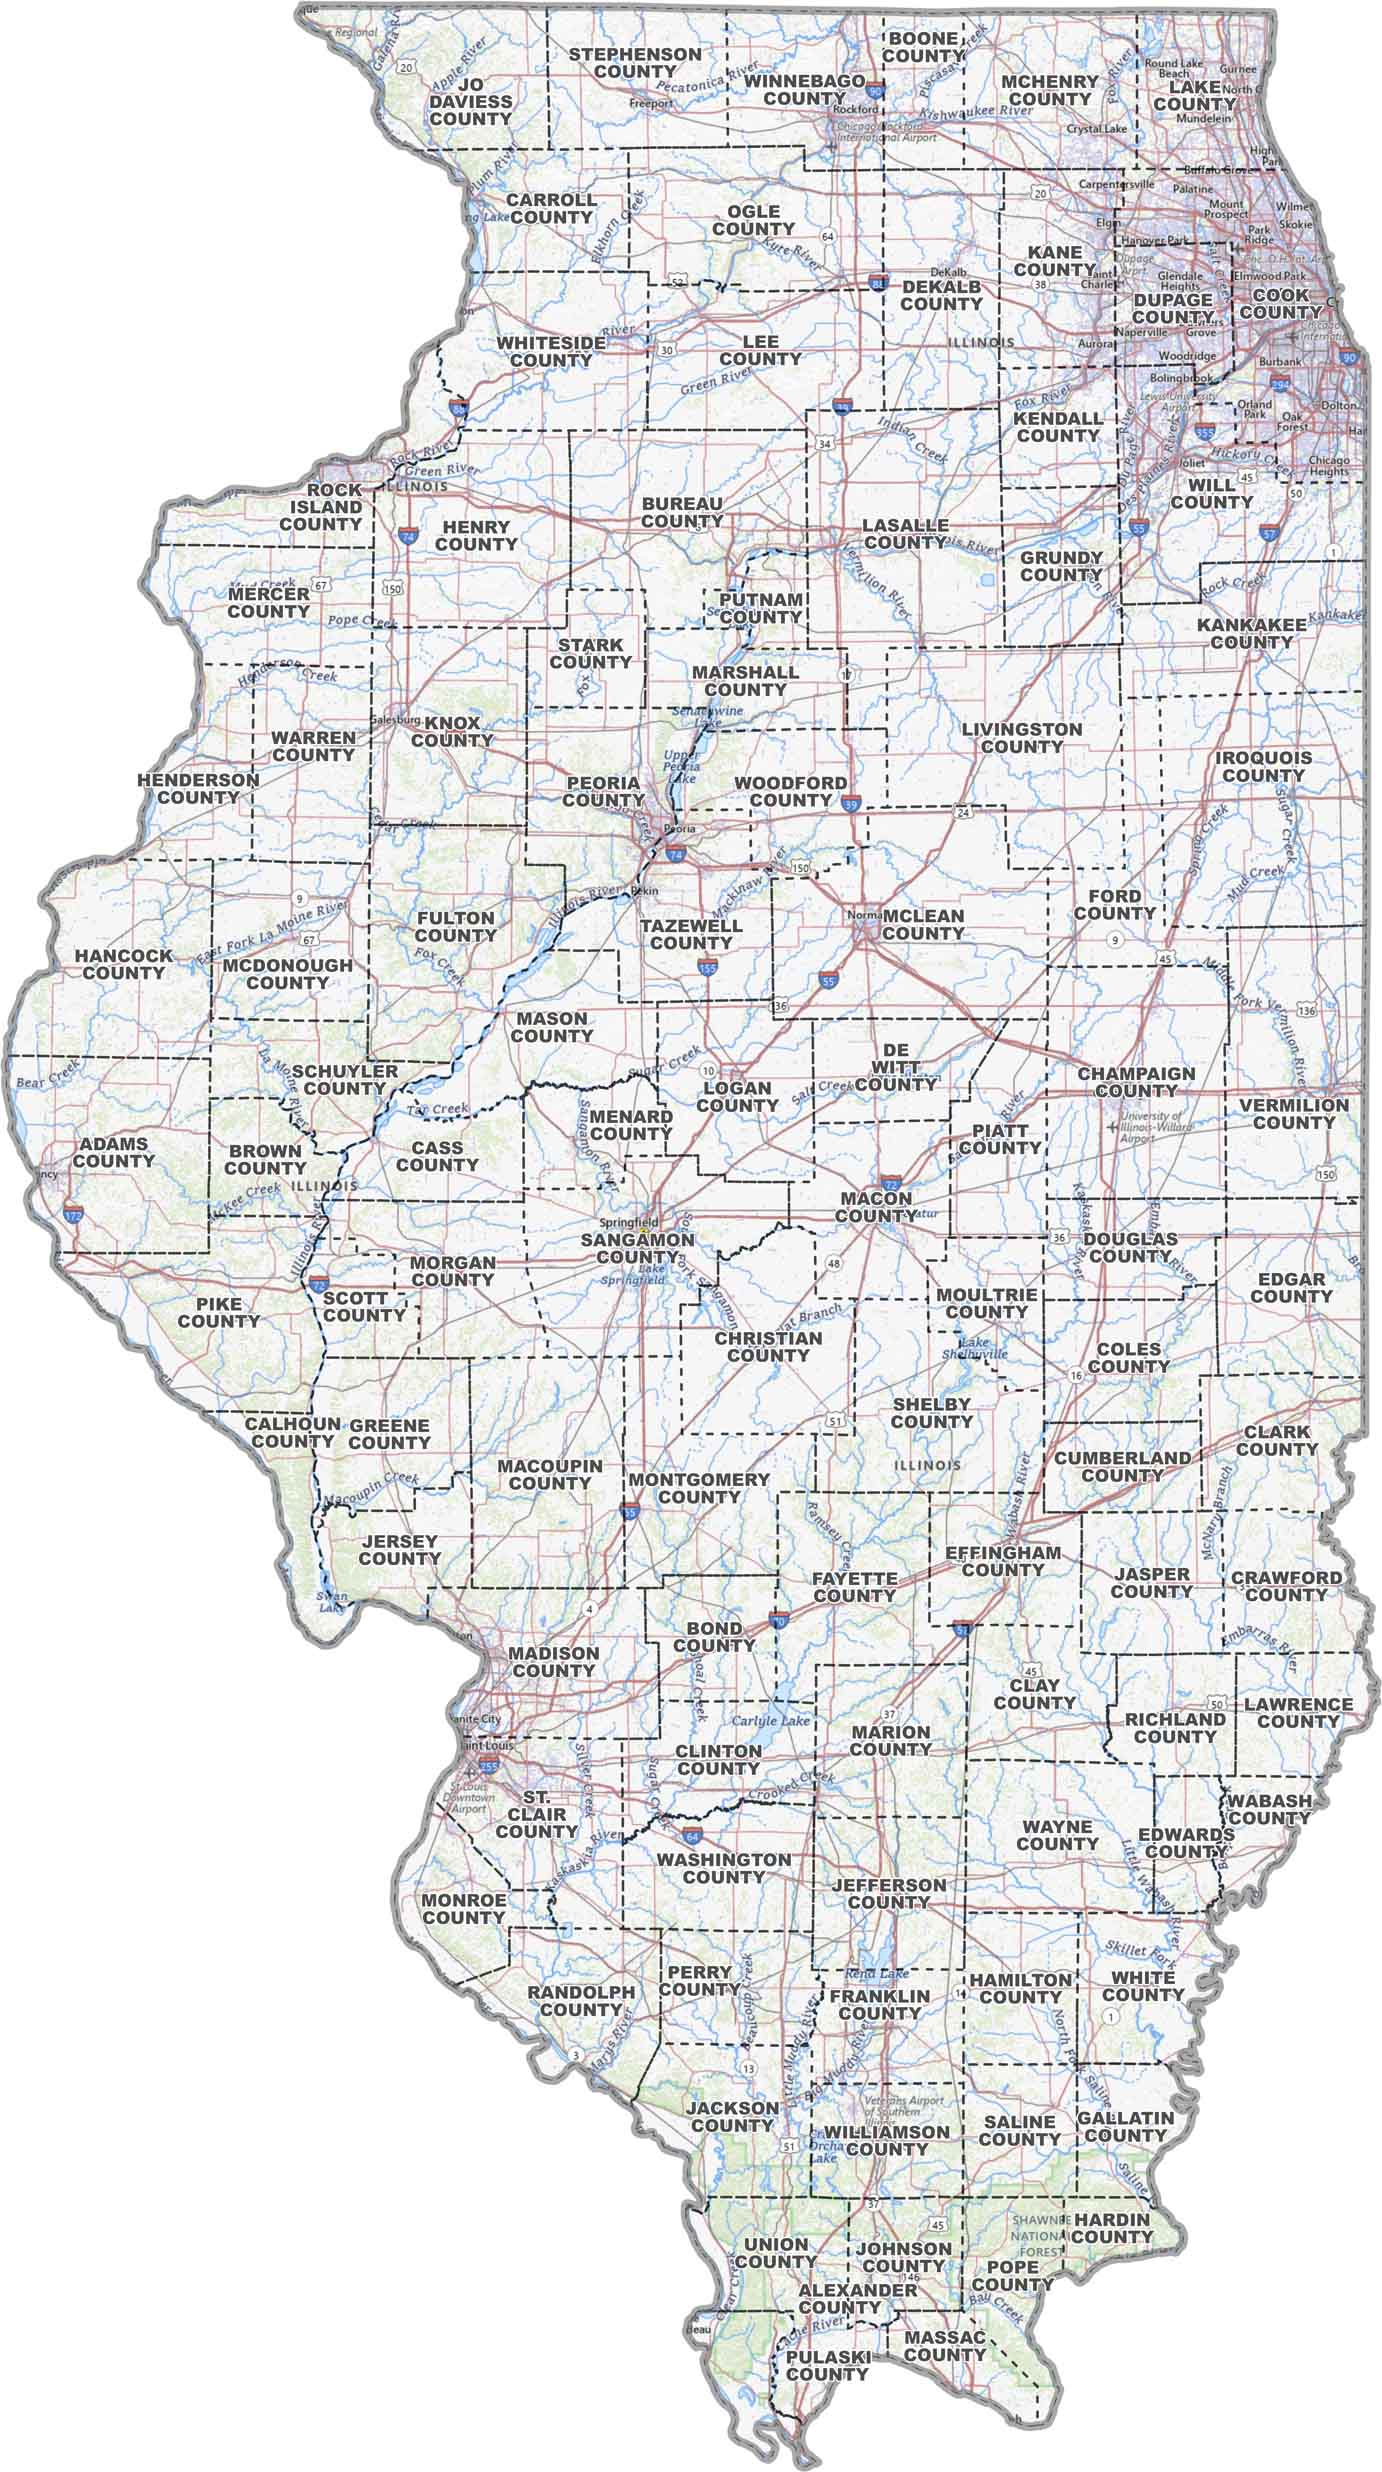
Illinois County Maps
The state of Illinois has 102 counties. Explore them all in our maps below.


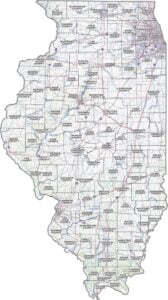
PHYSICAL MAP
Illinois Topographic County Map
Illinois is mostly flat, but with some low river valleys and higher ground near the southern tip. Our Illinois topographic county map is a clear way to see counties and highways across the state.
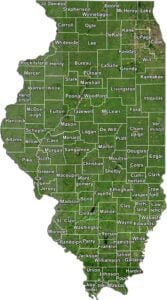
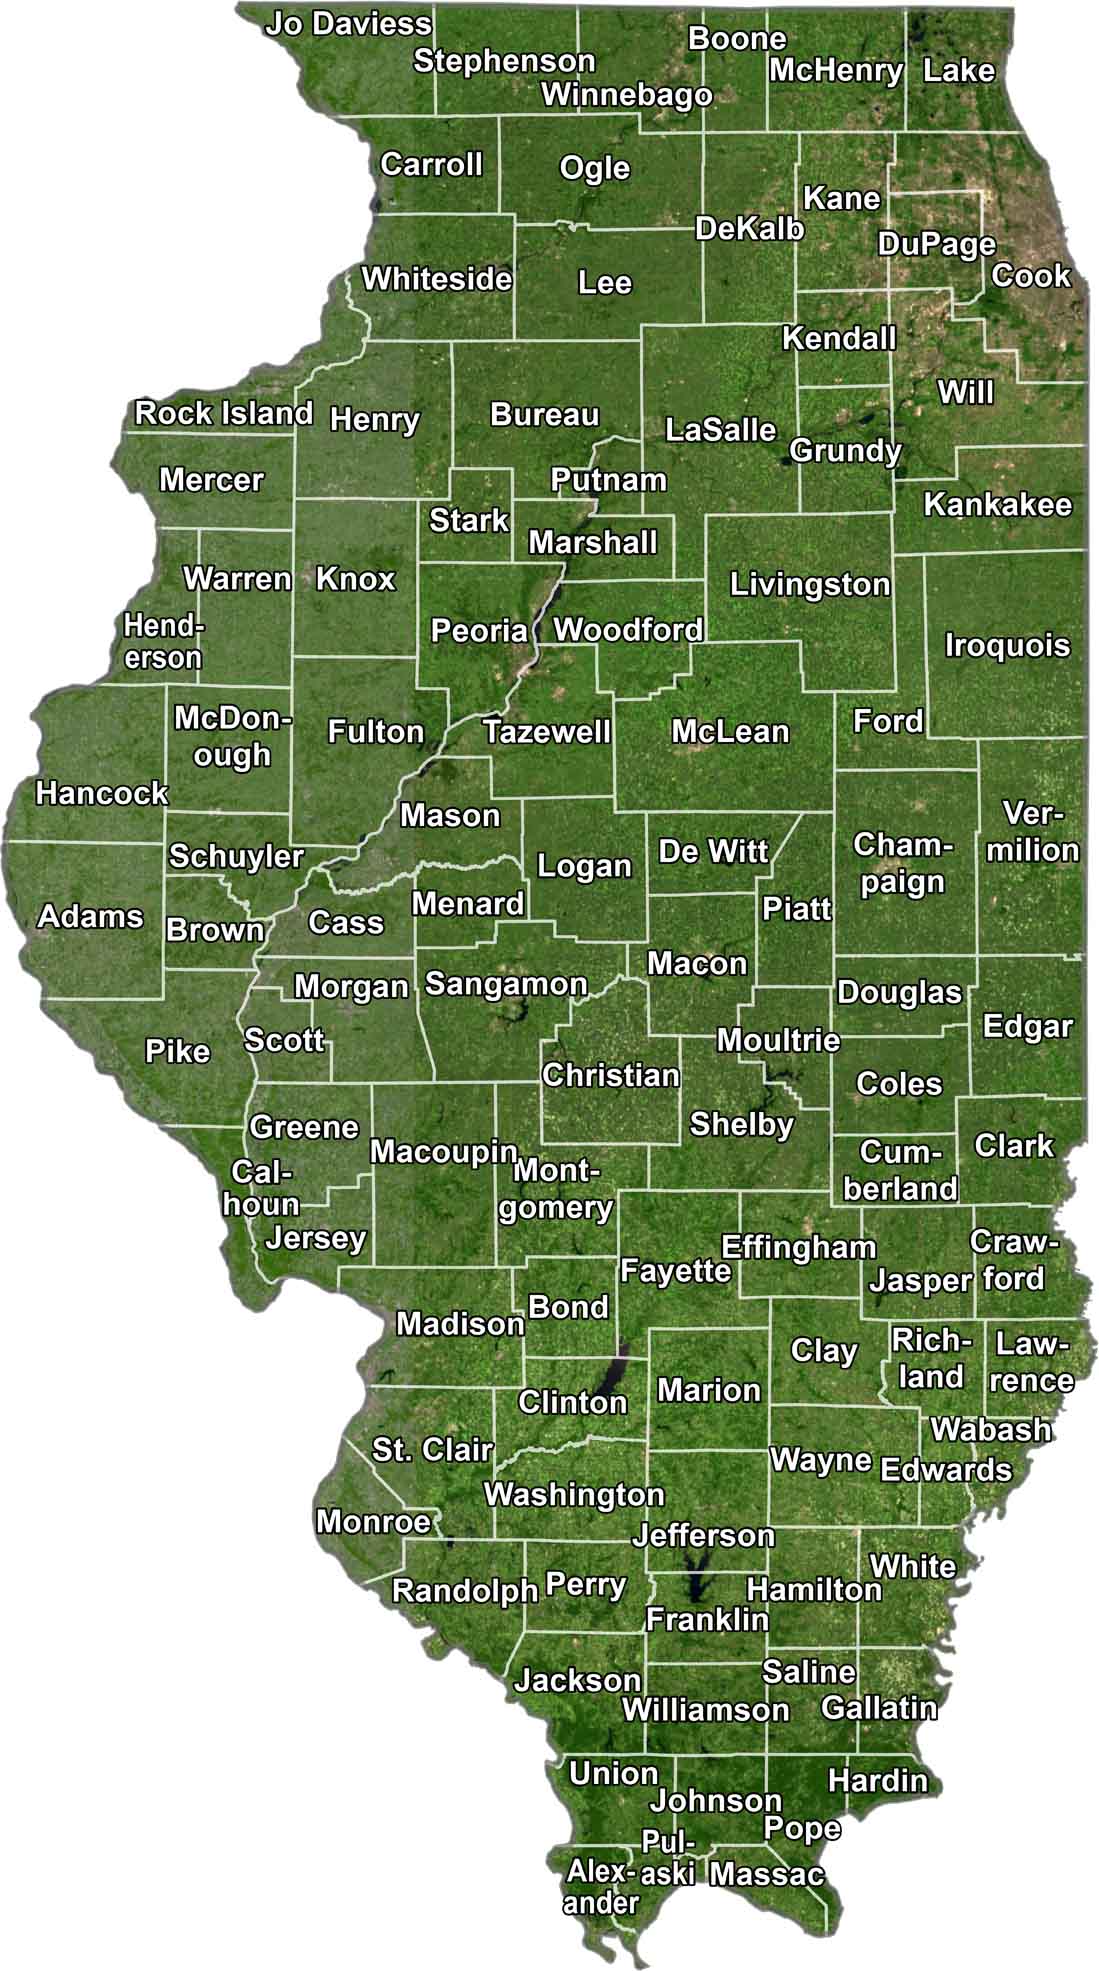
SATELLITE IMAGERY
Illinois Satellite County Map
Our satellite map of Illinois shows its farmland, forests, and urban areas. You’ll be able to pick out major cities, river systems, and county borders.
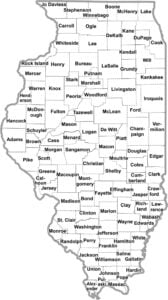
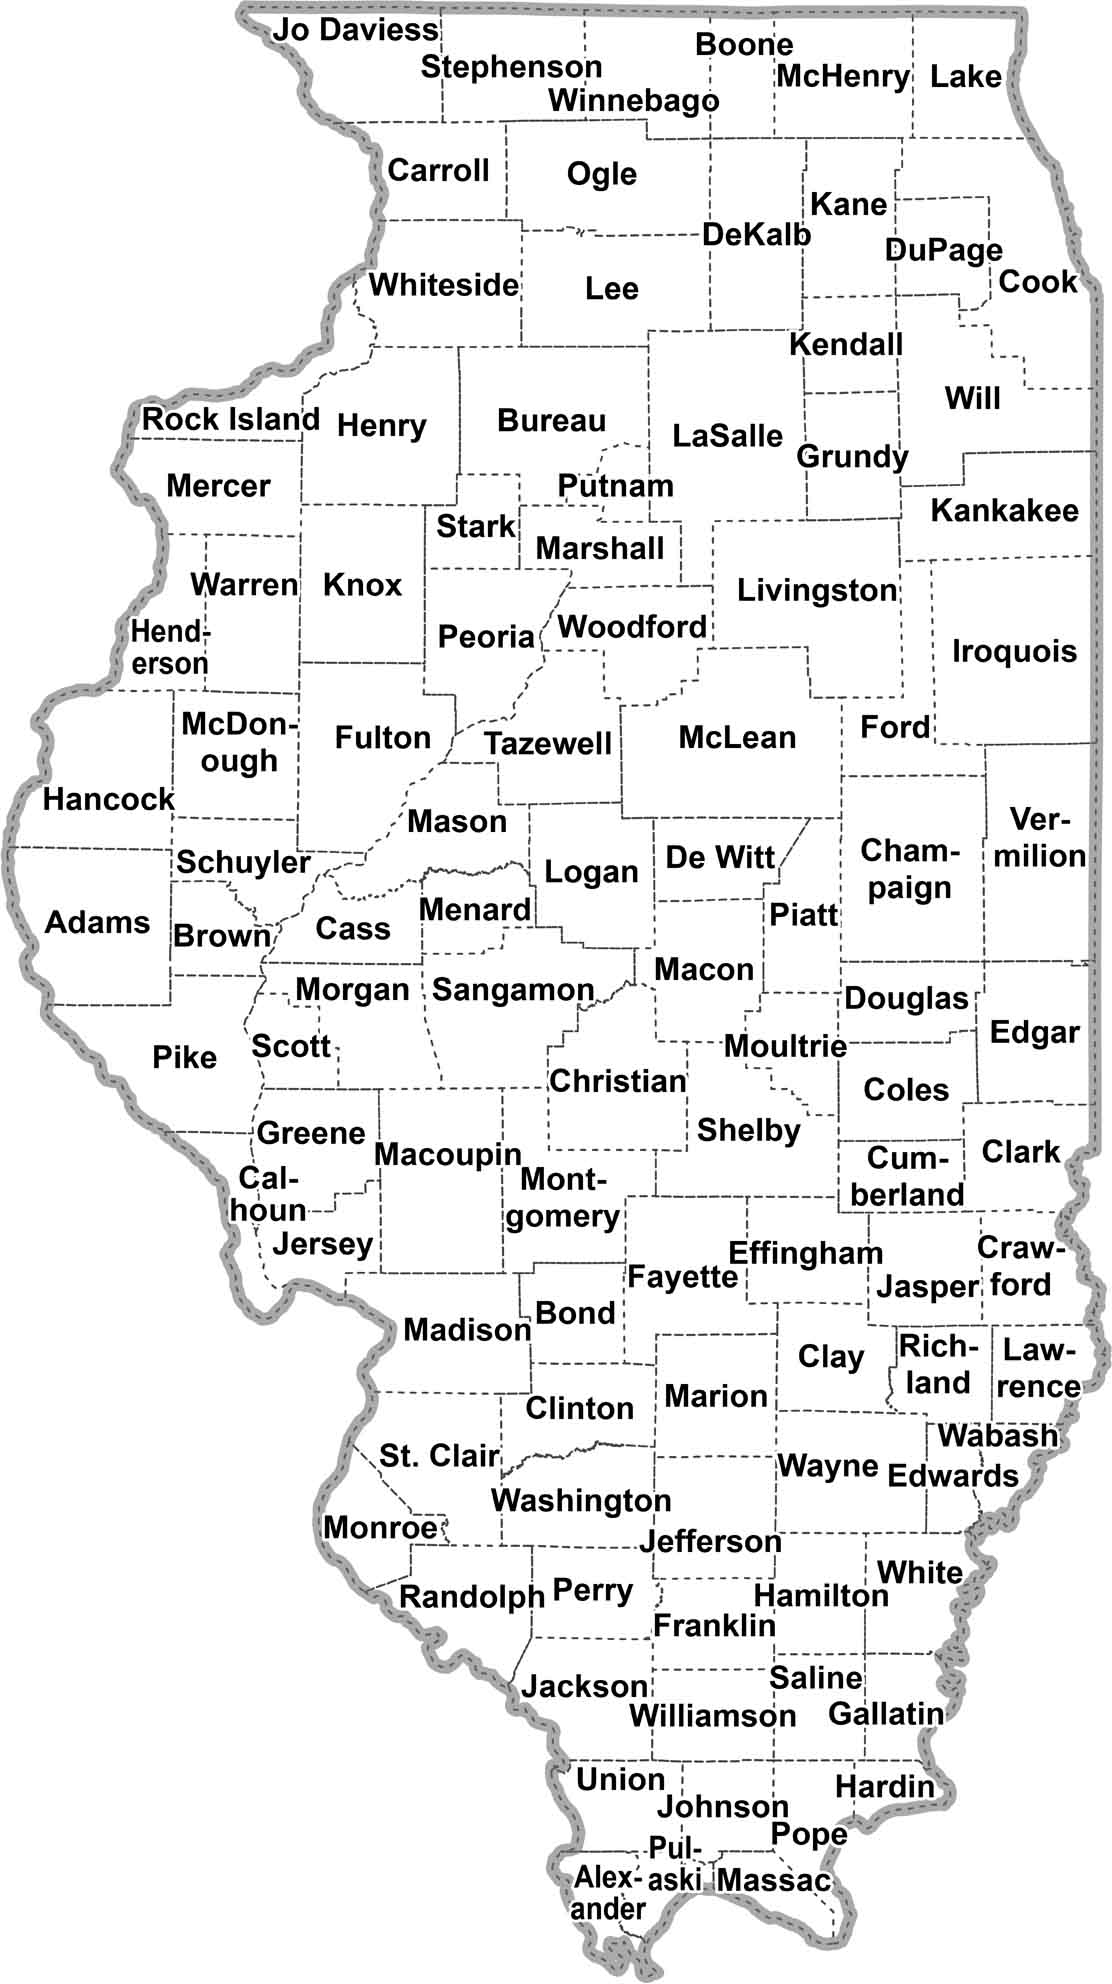
OUTLINE MAP
Illinois Simple County Map
This clean, simple map shows Illinois divided into its counties with clear lines and labels. Download it and print it with a black and white printer.
Illinois Counties
The most populous county is Cook County, and it’s not even close. With Chicago taking center stage, this urban powerhouse is home to over 5 million folks. That’s nearly half the state’s population crammed into one county. The least populous county is Hardin County with just over 3,800 residents.
Most Populous: Cook County
Least Populous: Hardin County

When it comes to size, things are get a bit weird. Taking into account just land area, McLean County has the largest landmass. But if you include water, then Cook County is largest. Putnam County is just 160 square miles in landmass. This makes it the smallest in size of all counties in Illinois.
Largest Area: McLean County
Smallest Area: Putnam County
Illinois counties have some stories behind their names. Take Effingham County. It’s named after Lord Effingham, a British general. And speaking of history, St. Clair County holds the title of oldest county in the state, established in 1790. That’s older than blue jeans and the light bulb.
Illinois County List
Here’s a complete list of all the counties in Illinois:
| FIPS Code | Name | Land % | Water % | Total Area (sq mi) |
|---|---|---|---|---|
| 17-001 | Adams County | 98.1 | 1.9 | 871.3 |
| 17-003 | Alexander County | 93.2 | 6.8 | 252.6 |
| 17-005 | Bond County | 99.3 | 0.7 | 382.8 |
| 17-007 | Boone County | 99.5 | 0.5 | 282.1 |
| 17-009 | Brown County | 99.5 | 0.5 | 307.3 |
| 17-011 | Bureau County | 99.5 | 0.5 | 873.6 |
| 17-013 | Calhoun County | 89.5 | 10.5 | 283.6 |
| 17-015 | Carroll County | 95.4 | 4.6 | 466.6 |
| 17-017 | Cass County | 97.9 | 2.1 | 383.7 |
| 17-019 | Champaign County | 99.8 | 0.2 | 998.5 |
| 17-021 | Christian County | 99.1 | 0.9 | 715.8 |
| 17-023 | Clark County | 99.3 | 0.7 | 504.8 |
| 17-025 | Clay County | 99.7 | 0.3 | 469.5 |
| 17-027 | Clinton County | 94.2 | 5.8 | 503.2 |
| 17-029 | Coles County | 99.6 | 0.4 | 510.1 |
| 17-031 | Cook County | 57.8 | 42.2 | 1,634.6 |
| 17-033 | Crawford County | 99.5 | 0.5 | 445.8 |
| 17-035 | Cumberland County | 99.7 | 0.3 | 346.9 |
| 17-037 | DeKalb County | 99.5 | 0.5 | 634.6 |
| 17-039 | De Witt County | 98.1 | 1.9 | 405.1 |
| 17-041 | Douglas County | 99.9 | 0.1 | 417.2 |
| 17-043 | DuPage County | 97.4 | 2.6 | 336.4 |
| 17-045 | Edgar County | 99.9 | 0.1 | 624.0 |
| 17-047 | Edwards County | 99.9 | 0.1 | 222.7 |
| 17-049 | Effingham County | 99.7 | 0.3 | 480.0 |
| 17-051 | Fayette County | 98.8 | 1.2 | 725.3 |
| 17-053 | Ford County | 99.9 | 0.1 | 486.2 |
| 17-055 | Franklin County | 94.8 | 5.2 | 431.4 |
| 17-057 | Fulton County | 98.1 | 1.9 | 882.7 |
| 17-059 | Gallatin County | 98.4 | 1.6 | 328.1 |
| 17-061 | Greene County | 99.4 | 0.6 | 546.3 |
| 17-063 | Grundy County | 97.1 | 2.9 | 430.5 |
| 17-065 | Hamilton County | 99.7 | 0.3 | 435.9 |
| 17-067 | Hancock County | 97.5 | 2.5 | 814.4 |
| 17-069 | Hardin County | 97.7 | 2.3 | 181.6 |
| 17-071 | Henderson County | 95.8 | 4.2 | 395.2 |
| 17-073 | Henry County | 99.7 | 0.3 | 825.6 |
| 17-075 | Iroquois County | 99.9 | 0.1 | 1,119.0 |
| 17-077 | Jackson County | 97.0 | 3.0 | 602.4 |
| 17-079 | Jasper County | 99.3 | 0.7 | 498.2 |
| 17-081 | Jefferson County | 97.8 | 2.2 | 583.8 |
| 17-083 | Jersey County | 97.9 | 2.1 | 377.1 |
| 17-085 | Jo Daviess County | 97.1 | 2.9 | 618.6 |
| 17-087 | Johnson County | 98.6 | 1.4 | 348.9 |
| 17-089 | Kane County | 99.1 | 0.9 | 524.2 |
| 17-091 | Kankakee County | 99.3 | 0.7 | 681.3 |
| 17-093 | Kendall County | 99.4 | 0.6 | 322.2 |
| 17-095 | Knox County | 99.5 | 0.5 | 719.8 |
| 17-097 | Lake County | 32.4 | 67.6 | 1,368.3 |
| 17-099 | LaSalle County | 98.9 | 1.1 | 1,148.2 |
| 17-101 | Lawrence County | 99.5 | 0.5 | 374.1 |
| 17-103 | Lee County | 99.4 | 0.6 | 728.9 |
| 17-105 | Livingston County | 99.8 | 0.2 | 1,045.9 |
| 17-107 | Logan County | 99.9 | 0.1 | 618.9 |
| 17-109 | McDonough County | 99.9 | 0.1 | 590.2 |
| 17-111 | McHenry County | 98.7 | 1.3 | 611.1 |
| 17-113 | McLean County | 99.7 | 0.3 | 1,186.3 |
| 17-115 | Macon County | 99.1 | 0.9 | 585.7 |
| 17-117 | Macoupin County | 99.5 | 0.5 | 867.6 |
| 17-119 | Madison County | 96.7 | 3.3 | 740.5 |
| 17-121 | Marion County | 99.4 | 0.6 | 576.0 |
| 17-123 | Marshall County | 97.1 | 2.9 | 398.5 |
| 17-125 | Mason County | 95.7 | 4.3 | 563.5 |
| 17-127 | Massac County | 98.1 | 1.9 | 241.8 |
| 17-129 | Menard County | 99.7 | 0.3 | 315.5 |
| 17-131 | Mercer County | 98.7 | 1.3 | 568.7 |
| 17-133 | Monroe County | 96.7 | 3.3 | 398.3 |
| 17-135 | Montgomery County | 99.2 | 0.8 | 709.6 |
| 17-137 | Morgan County | 99.4 | 0.6 | 572.3 |
| 17-139 | Moultrie County | 97.5 | 2.5 | 344.5 |
| 17-141 | Ogle County | 99.4 | 0.6 | 763.0 |
| 17-143 | Peoria County | 98.1 | 1.9 | 630.5 |
| 17-145 | Perry County | 98.8 | 1.2 | 446.9 |
| 17-147 | Piatt County | 99.9 | 0.1 | 439.4 |
| 17-149 | Pike County | 97.9 | 2.1 | 848.9 |
| 17-151 | Pope County | 98.5 | 1.5 | 374.3 |
| 17-153 | Pulaski County | 98.0 | 2.0 | 203.2 |
| 17-155 | Putnam County | 93.0 | 7.0 | 172.1 |
| 17-157 | Randolph County | 96.4 | 3.6 | 597.0 |
| 17-159 | Richland County | 99.5 | 0.5 | 361.9 |
| 17-161 | Rock Island County | 94.7 | 5.3 | 451.3 |
| 17-163 | St. Clair County | 97.6 | 2.4 | 673.9 |
| 17-165 | Saline County | 98.2 | 1.8 | 386.8 |
| 17-167 | Sangamon County | 99.0 | 1.0 | 877.0 |
| 17-169 | Schuyler County | 99.1 | 0.9 | 441.3 |
| 17-171 | Scott County | 99.3 | 0.7 | 252.8 |
| 17-173 | Shelby County | 98.8 | 1.2 | 768.1 |
| 17-175 | Stark County | 99.9 | 0.1 | 288.3 |
| 17-177 | Stephenson County | 99.9 | 0.1 | 565.1 |
| 17-179 | Tazewell County | 98.2 | 1.8 | 657.9 |
| 17-181 | Union County | 97.9 | 2.1 | 422.1 |
| 17-183 | Vermilion County | 99.7 | 0.3 | 901.2 |
| 17-185 | Wabash County | 98.1 | 1.9 | 227.5 |
| 17-187 | Warren County | 99.9 | 0.1 | 543.0 |
| 17-189 | Washington County | 99.8 | 0.2 | 563.9 |
| 17-191 | Wayne County | 99.8 | 0.2 | 715.5 |
| 17-193 | White County | 98.6 | 1.4 | 501.9 |
| 17-195 | Whiteside County | 98.2 | 1.8 | 696.5 |
| 17-197 | Will County | 98.4 | 1.6 | 849.2 |
| 17-199 | Williamson County | 94.6 | 5.4 | 444.3 |
| 17-201 | Winnebago County | 98.9 | 1.1 | 519.2 |
| 17-203 | Woodford County | 97.3 | 2.7 | 542.6 |
Source: United States Census Bureau