Tennessee County Map

Tennessee County Map Collection
We allow you to use our Tennessee County map. Attribution is required.
Tennessee County Maps
Click on any of the county maps below to see what that it looks like geographically.


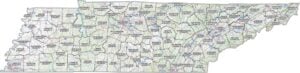
PHYSICAL MAP
Tennessee Topographic County Map
Here’s Tennessee mapped out from Memphis to the Smokies. It includes county outlines, major highways, cities and much more.

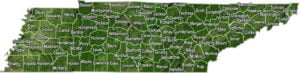
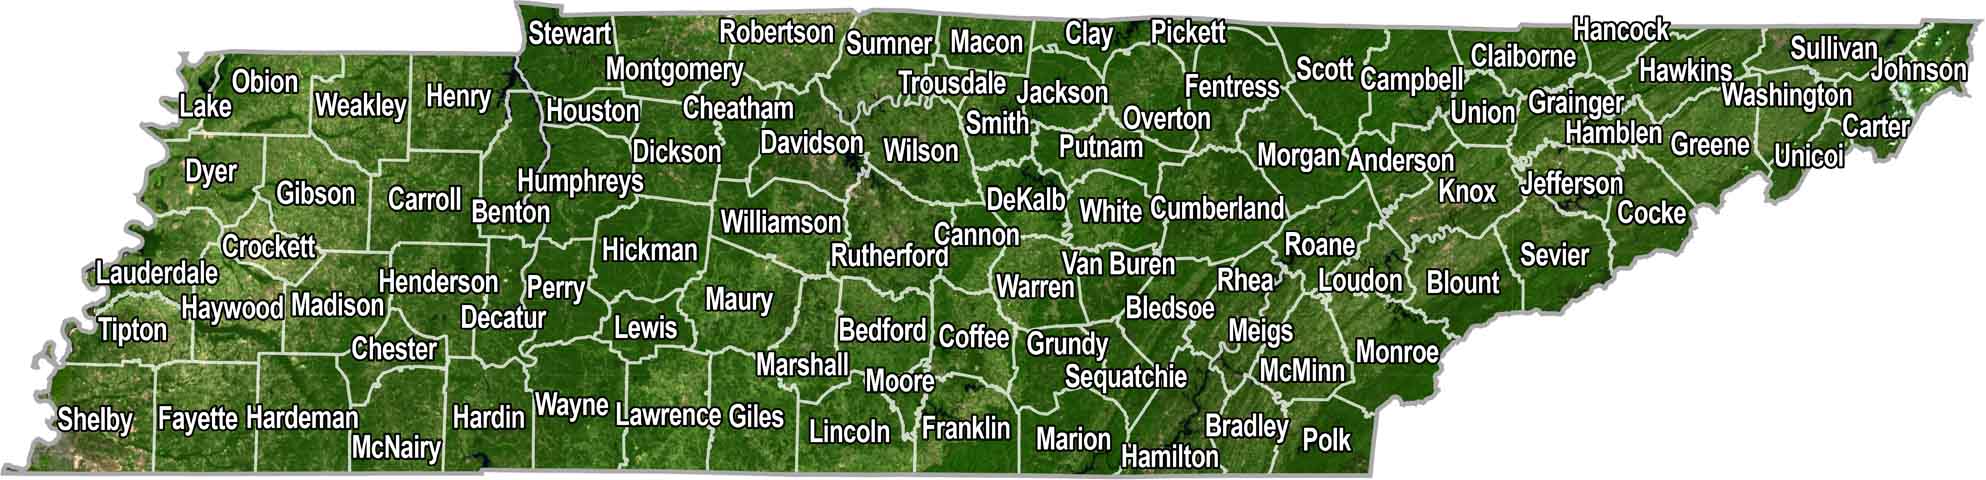
SATELLITE IMAGERY
Tennessee Satellite County Map
Tennessee from above looks like a A LOT of green, winding rivers, and scattered cities. Our satellite map captures the whole mix, showing its county outline as well.
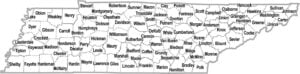
OUTLINE MAP
Tennessee Simple County Map
This is just a clean, easy view of Tennessee’s county layout. Get a clear breakdown of how the state is divided into its 96 counties.

Tennessee Counties
I want to talk a bit about population in Tennessee’s counties. Davidson County is the highest in terms of population. It’s where you’ll find Nashville, the state capital and a major hub for music. Then there’s Pickett County, the least populated in the state. It’s in the north, mostly rural with some beautiful scenery around it.
Most Populous: Davidson County
Least Populous: Pickett County

Shelby County is the largest county when it comes to size, spanning over 750 square miles. It’s home to Memphis, so you’ve got a mix of urban areas and farmland. The smallest county is Trousdale County, just 114 square miles.
Largest Area: Shelby County
Smallest Area: Trousdale County
Tennessee’s counties have some interesting backstories. Washington County, the oldest, was established way back in 1777. And get this – the state constitution requires that no county can be smaller than 275 square miles. That’s why Trousdale County is such an oddball as it was created before that rule was put in place.
The state’s layout is a real mix. You’ve got mountains in the east, rolling hills in the middle, and flat lands out west. From the Appalachians to the Mississippi River, each of Tennessee’s counties has its own character. This variety means each county has its own look and feel.
Tennessee County List
Our table below lists out all of the counties in Tennessee, row-by-row.
| FIPS Code | Name | Land % | Water % | Total Area (sq mi) |
|---|---|---|---|---|
| 47-001 | Anderson County | 97.8 | 2.2 | 344.8 |
| 47-003 | Bedford County | 99.8 | 0.2 | 474.8 |
| 47-005 | Benton County | 90.4 | 9.6 | 436.2 |
| 47-007 | Bledsoe County | 99.9 | 0.1 | 406.7 |
| 47-009 | Blount County | 98.6 | 1.4 | 566.6 |
| 47-011 | Bradley County | 99.2 | 0.8 | 331.4 |
| 47-013 | Campbell County | 96.4 | 3.6 | 498.1 |
| 47-015 | Cannon County | 100.0 | 0.0 | 265.7 |
| 47-017 | Carroll County | 99.6 | 0.4 | 600.1 |
| 47-019 | Carter County | 98.1 | 1.9 | 347.7 |
| 47-021 | Cheatham County | 98.5 | 1.5 | 307.1 |
| 47-023 | Chester County | 99.9 | 0.1 | 286.0 |
| 47-025 | Claiborne County | 98.4 | 1.6 | 441.6 |
| 47-027 | Clay County | 91.2 | 8.8 | 259.3 |
| 47-029 | Cocke County | 98.4 | 1.6 | 443.1 |
| 47-031 | Coffee County | 98.7 | 1.3 | 434.6 |
| 47-033 | Crockett County | 99.9 | 0.1 | 265.7 |
| 47-035 | Cumberland County | 99.4 | 0.6 | 684.8 |
| 47-037 | Davidson County | 95.8 | 4.2 | 525.3 |
| 47-039 | Decatur County | 96.8 | 3.2 | 344.9 |
| 47-041 | DeKalb County | 92.5 | 7.5 | 329.0 |
| 47-043 | Dickson County | 99.7 | 0.3 | 491.3 |
| 47-045 | Dyer County | 97.3 | 2.7 | 526.5 |
| 47-047 | Fayette County | 99.8 | 0.2 | 706.2 |
| 47-049 | Fentress County | 99.9 | 0.1 | 498.9 |
| 47-051 | Franklin County | 96.3 | 3.7 | 575.7 |
| 47-053 | Gibson County | 99.8 | 0.2 | 603.6 |
| 47-055 | Giles County | 100.0 | 0.0 | 611.2 |
| 47-057 | Grainger County | 92.8 | 7.2 | 302.4 |
| 47-059 | Greene County | 99.7 | 0.3 | 624.1 |
| 47-061 | Grundy County | 99.8 | 0.2 | 361.1 |
| 47-063 | Hamblen County | 91.7 | 8.3 | 175.8 |
| 47-065 | Hamilton County | 94.2 | 5.8 | 575.8 |
| 47-067 | Hancock County | 99.5 | 0.5 | 223.5 |
| 47-069 | Hardeman County | 99.6 | 0.4 | 670.4 |
| 47-071 | Hardin County | 96.8 | 3.2 | 596.3 |
| 47-073 | Hawkins County | 97.5 | 2.5 | 499.6 |
| 47-075 | Haywood County | 99.8 | 0.2 | 534.1 |
| 47-077 | Henderson County | 98.9 | 1.1 | 525.9 |
| 47-079 | Henry County | 94.7 | 5.3 | 593.4 |
| 47-081 | Hickman County | 100.0 | 0.0 | 612.6 |
| 47-083 | Houston County | 96.8 | 3.2 | 207.0 |
| 47-085 | Humphreys County | 95.3 | 4.7 | 556.7 |
| 47-087 | Jackson County | 96.6 | 3.4 | 319.5 |
| 47-089 | Jefferson County | 87.5 | 12.5 | 314.3 |
| 47-091 | Johnson County | 98.6 | 1.4 | 302.7 |
| 47-093 | Knox County | 96.7 | 3.3 | 525.9 |
| 47-095 | Lake County | 85.5 | 14.5 | 193.9 |
| 47-097 | Lauderdale County | 93.0 | 7.0 | 507.6 |
| 47-099 | Lawrence County | 99.9 | 0.1 | 618.0 |
| 47-101 | Lewis County | 99.9 | 0.1 | 282.5 |
| 47-103 | Lincoln County | 99.9 | 0.1 | 570.7 |
| 47-105 | Loudon County | 92.7 | 7.3 | 247.4 |
| 47-107 | McMinn County | 99.5 | 0.5 | 432.2 |
| 47-109 | McNairy County | 99.9 | 0.1 | 563.6 |
| 47-111 | Macon County | 100.0 | 0.0 | 307.2 |
| 47-113 | Madison County | 99.7 | 0.3 | 558.6 |
| 47-115 | Marion County | 97.3 | 2.7 | 512.3 |
| 47-117 | Marshall County | 99.8 | 0.2 | 376.2 |
| 47-119 | Maury County | 99.6 | 0.4 | 615.6 |
| 47-121 | Meigs County | 90.0 | 10.0 | 216.7 |
| 47-123 | Monroe County | 97.4 | 2.6 | 652.6 |
| 47-125 | Montgomery County | 99.1 | 0.9 | 543.8 |
| 47-127 | Moore County | 99.1 | 0.9 | 130.4 |
| 47-129 | Morgan County | 99.9 | 0.1 | 522.5 |
| 47-131 | Obion County | 98.1 | 1.9 | 555.4 |
| 47-133 | Overton County | 99.7 | 0.3 | 434.8 |
| 47-135 | Perry County | 98.1 | 1.9 | 422.9 |
| 47-137 | Pickett County | 93.4 | 6.6 | 174.5 |
| 47-139 | Polk County | 98.3 | 1.7 | 442.3 |
| 47-141 | Putnam County | 99.6 | 0.4 | 402.6 |
| 47-143 | Rhea County | 93.8 | 6.2 | 336.4 |
| 47-145 | Roane County | 91.3 | 8.7 | 395.0 |
| 47-147 | Robertson County | 100.0 | 0.0 | 476.5 |
| 47-149 | Rutherford County | 99.2 | 0.8 | 624.1 |
| 47-151 | Scott County | 99.8 | 0.2 | 533.2 |
| 47-153 | Sequatchie County | 99.9 | 0.1 | 266.0 |
| 47-155 | Sevier County | 99.1 | 0.9 | 597.7 |
| 47-157 | Shelby County | 97.3 | 2.7 | 785.0 |
| 47-159 | Smith County | 96.6 | 3.4 | 325.4 |
| 47-161 | Stewart County | 93.3 | 6.7 | 493.0 |
| 47-163 | Sullivan County | 96.2 | 3.8 | 429.7 |
| 47-165 | Sumner County | 97.5 | 2.5 | 543.2 |
| 47-167 | Tipton County | 96.9 | 3.1 | 473.3 |
| 47-169 | Trousdale County | 98.0 | 2.0 | 116.6 |
| 47-171 | Unicoi County | 99.8 | 0.2 | 186.4 |
| 47-173 | Union County | 90.5 | 9.5 | 247.1 |
| 47-175 | Van Buren County | 99.6 | 0.4 | 274.5 |
| 47-177 | Warren County | 99.7 | 0.3 | 434.0 |
| 47-179 | Washington County | 99.0 | 1.0 | 329.8 |
| 47-181 | Wayne County | 99.8 | 0.2 | 735.7 |
| 47-183 | Weakley County | 99.8 | 0.2 | 581.8 |
| 47-185 | White County | 99.3 | 0.7 | 379.4 |
| 47-187 | Williamson County | 99.8 | 0.2 | 584.0 |
| 47-189 | Wilson County | 97.9 | 2.1 | 583.5 |
Source: United States Census Bureau