Texas County Map

Texas County Map Collection
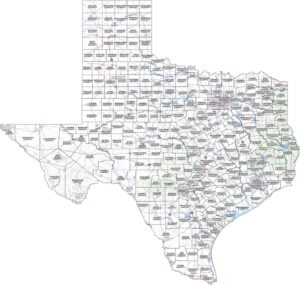
We allow you to use our Texas County map. Attribution is required.
Texas County Maps
Texas has a whopping 254 counties, more than any other state in the U.S. The Lone Star State’s huge size is part of the reason. Click any county map below for further details.


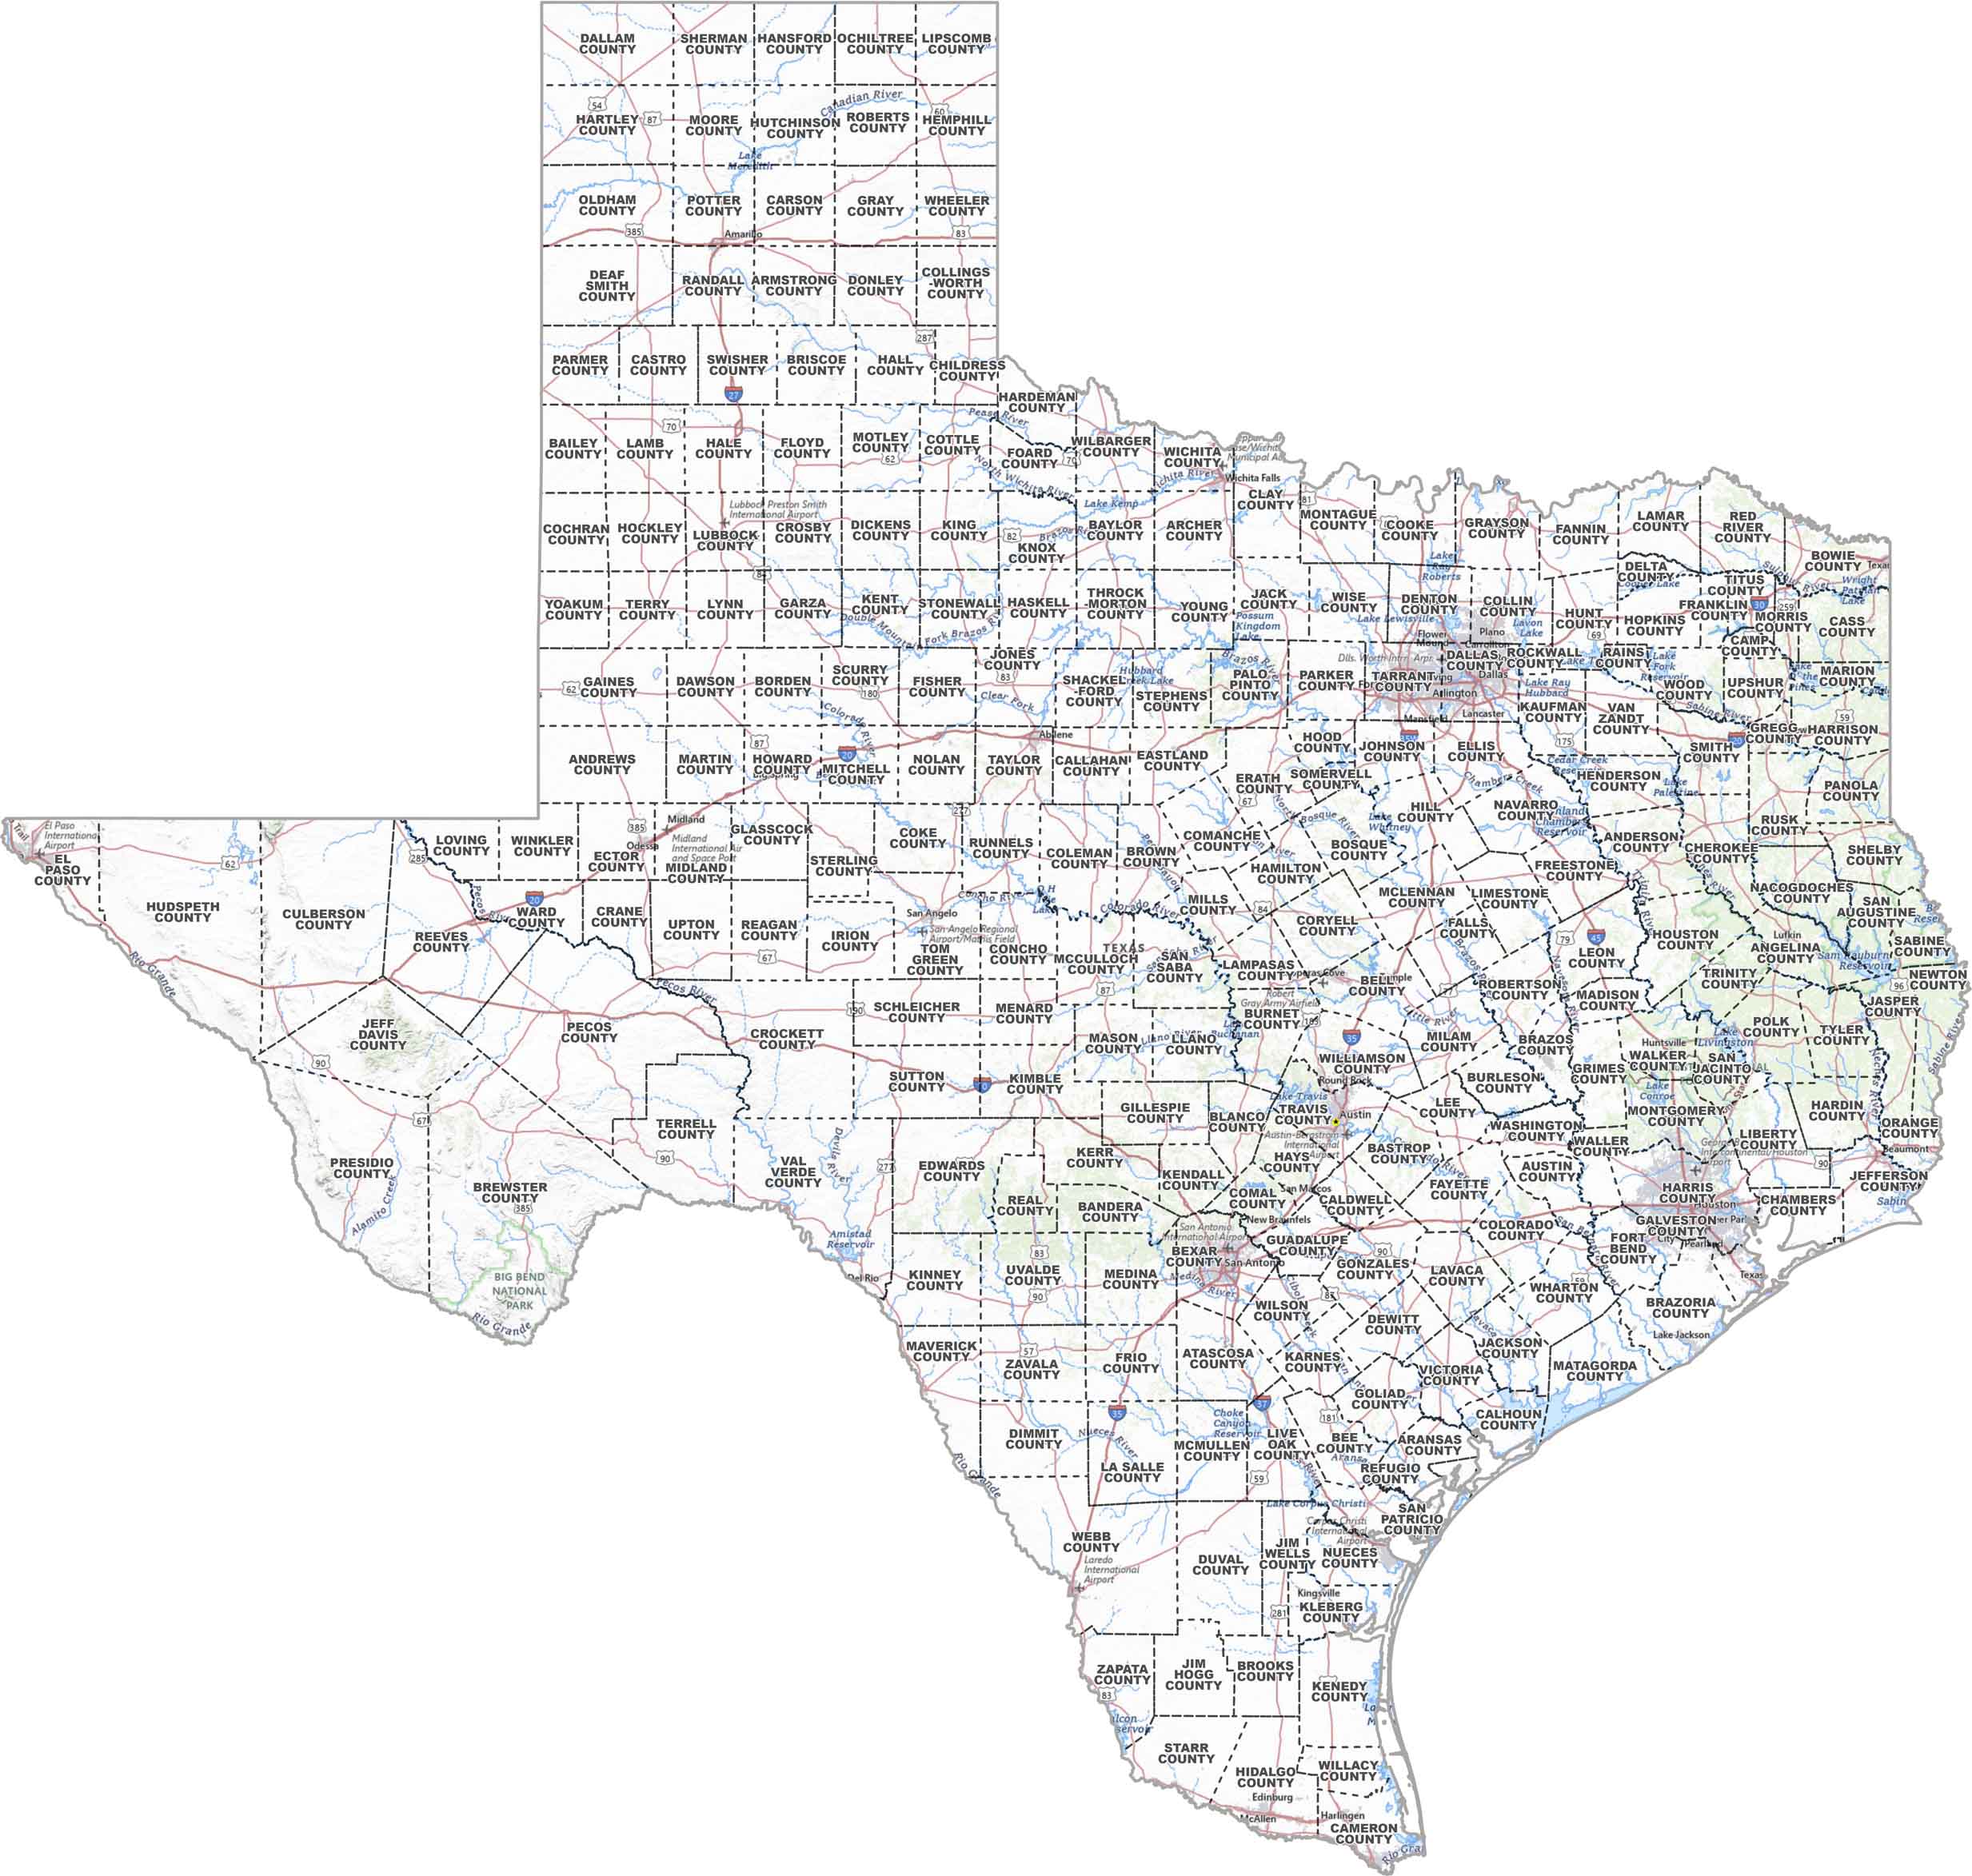
PHYSICAL MAP
Texas Topographic County Map
Texas doesn’t do small, and neither does this map. From Amarillo to Brownsville, you’ll see every county laid out. It’s the whole picture, Texas-style.
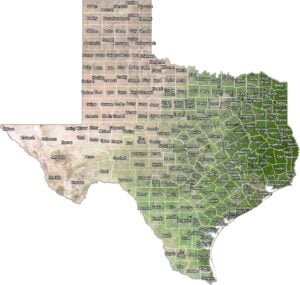
SATELLITE IMAGERY
Texas Satellite County Map
Zoom out and you’ll see it all. Desert stretches out west, green pockets in the east, winding rivers, city clusters, and that long Gulf coastline. Our satellite map captures the land as it is with county lines.

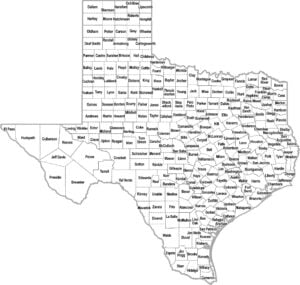
OUTLINE MAP
Texas Simple County Map
One state, 254 counties, no distractions. Just Texas, broken down cleanly so you can see how it’s all divided. Big map, simple style.

Texas Counties
This is one of the most populated states in the United States. Harris County has the highest population because it’s home to Houston, the state’s largest city. Loving County is the least populated in the whole country. It’s out in West Texas, mostly empty desert. Last count, it had less than 100 people.
Most Populous: Harris County
Least Populous: Loving County

Brewster County is the largest for size. It’s bigger than some states, covering 6,183.2 square miles. Big Bend National Park takes up a good chunk of it. The smallest county is Rockwall County at about 149 square miles, which is tiny by Texas standards.
Largest Area: Brewster County
Smallest Area: Rockwall County
Texas counties have some quirks. Like how Deaf Smith County got its name from a guy who was actually deaf. Or how Zapata County had to move its entire county seat because the old one got flooded when they built a dam.
From the Panhandle to the Gulf Coast, counties are where Texans live, work, and argue about who makes the best barbecue. Whether you’re into big city life or prefer wide open spaces, there’s a county for you.
Texas County List
Below is a lot of rows. 254 rows, to be exact. One for each county, with total area.
| FIPS Code | Name | Land % | Water % | Total Area (sq mi) |
|---|---|---|---|---|
| 48-001 | Anderson County | 98.6 | 1.4 | 1,078.0 |
| 48-003 | Andrews County | 100.0 | 0.0 | 1,501.1 |
| 48-005 | Angelina County | 92.3 | 7.7 | 864.7 |
| 48-007 | Aransas County | 47.7 | 52.3 | 528.0 |
| 48-009 | Archer County | 97.6 | 2.4 | 925.6 |
| 48-011 | Armstrong County | 99.5 | 0.5 | 913.8 |
| 48-013 | Atascosa County | 99.8 | 0.2 | 1,221.5 |
| 48-015 | Austin County | 98.5 | 1.5 | 656.4 |
| 48-017 | Bailey County | 99.9 | 0.1 | 827.7 |
| 48-019 | Bandera County | 99.2 | 0.8 | 797.7 |
| 48-021 | Bastrop County | 99.2 | 0.8 | 895.5 |
| 48-023 | Baylor County | 96.3 | 3.7 | 901.1 |
| 48-025 | Bee County | 100.0 | 0.0 | 880.3 |
| 48-027 | Bell County | 96.6 | 3.4 | 1,087.8 |
| 48-029 | Bexar County | 98.7 | 1.3 | 1,256.1 |
| 48-031 | Blanco County | 99.4 | 0.6 | 713.4 |
| 48-033 | Borden County | 99.0 | 1.0 | 906.0 |
| 48-035 | Bosque County | 98.0 | 2.0 | 1,002.5 |
| 48-037 | Bowie County | 95.9 | 4.1 | 923.0 |
| 48-039 | Brazoria County | 84.7 | 15.3 | 1,608.6 |
| 48-041 | Brazos County | 99.0 | 1.0 | 591.2 |
| 48-043 | Brewster County | 99.9 | 0.1 | 6,192.2 |
| 48-045 | Briscoe County | 99.8 | 0.2 | 901.6 |
| 48-047 | Brooks County | 100.0 | 0.0 | 943.6 |
| 48-049 | Brown County | 98.7 | 1.3 | 956.9 |
| 48-051 | Burleson County | 97.4 | 2.6 | 676.8 |
| 48-053 | Burnet County | 97.4 | 2.6 | 1,021.3 |
| 48-055 | Caldwell County | 99.6 | 0.4 | 547.2 |
| 48-057 | Calhoun County | 49.1 | 50.9 | 1,032.7 |
| 48-059 | Callahan County | 99.8 | 0.2 | 901.3 |
| 48-061 | Cameron County | 69.8 | 30.2 | 1,276.4 |
| 48-063 | Camp County | 96.4 | 3.6 | 203.2 |
| 48-065 | Carson County | 99.6 | 0.4 | 924.1 |
| 48-067 | Cass County | 97.6 | 2.4 | 960.3 |
| 48-069 | Castro County | 99.5 | 0.5 | 899.3 |
| 48-071 | Chambers County | 68.5 | 31.5 | 871.2 |
| 48-073 | Cherokee County | 99.1 | 0.9 | 1,062.2 |
| 48-075 | Childress County | 97.6 | 2.4 | 713.7 |
| 48-077 | Clay County | 97.5 | 2.5 | 1,116.7 |
| 48-079 | Cochran County | 100.0 | 0.0 | 775.2 |
| 48-081 | Coke County | 98.2 | 1.8 | 928.0 |
| 48-083 | Coleman County | 98.6 | 1.4 | 1,281.4 |
| 48-085 | Collin County | 94.9 | 5.1 | 886.1 |
| 48-087 | Collingsworth County | 99.9 | 0.1 | 919.3 |
| 48-089 | Colorado County | 98.6 | 1.4 | 973.7 |
| 48-091 | Comal County | 97.3 | 2.7 | 574.9 |
| 48-093 | Comanche County | 99.0 | 1.0 | 947.7 |
| 48-095 | Concho County | 99.0 | 1.0 | 993.7 |
| 48-097 | Cooke County | 97.4 | 2.6 | 898.5 |
| 48-099 | Coryell County | 99.6 | 0.4 | 1,056.7 |
| 48-101 | Cottle County | 99.9 | 0.1 | 901.6 |
| 48-103 | Crane County | 99.9 | 0.1 | 785.7 |
| 48-105 | Crockett County | 100.0 | 0.0 | 2,807.3 |
| 48-107 | Crosby County | 99.8 | 0.2 | 901.7 |
| 48-109 | Culberson County | 100.0 | 0.0 | 3,812.3 |
| 48-111 | Dallam County | 99.9 | 0.1 | 1,505.1 |
| 48-113 | Dallas County | 96.0 | 4.0 | 908.6 |
| 48-115 | Dawson County | 99.8 | 0.2 | 902.1 |
| 48-117 | Deaf Smith County | 99.9 | 0.1 | 1,498.3 |
| 48-119 | Delta County | 92.4 | 7.6 | 277.9 |
| 48-121 | Denton County | 92.2 | 7.8 | 952.9 |
| 48-123 | DeWitt County | 99.8 | 0.2 | 910.5 |
| 48-125 | Dickens County | 99.6 | 0.4 | 905.2 |
| 48-127 | Dimmit County | 99.6 | 0.4 | 1,334.5 |
| 48-129 | Donley County | 99.3 | 0.7 | 933.0 |
| 48-131 | Duval County | 99.9 | 0.1 | 1,795.6 |
| 48-133 | Eastland County | 99.4 | 0.6 | 931.9 |
| 48-135 | Ector County | 99.6 | 0.4 | 901.8 |
| 48-137 | Edwards County | 99.9 | 0.1 | 2,119.9 |
| 48-139 | Ellis County | 98.3 | 1.7 | 951.7 |
| 48-141 | El Paso County | 99.8 | 0.2 | 1,015.3 |
| 48-143 | Erath County | 99.4 | 0.6 | 1,089.8 |
| 48-145 | Falls County | 98.9 | 1.1 | 773.8 |
| 48-147 | Fannin County | 99.1 | 0.9 | 898.9 |
| 48-149 | Fayette County | 99.0 | 1.0 | 959.8 |
| 48-151 | Fisher County | 99.7 | 0.3 | 901.7 |
| 48-153 | Floyd County | 100.0 | 0.0 | 992.5 |
| 48-155 | Foard County | 99.5 | 0.5 | 707.7 |
| 48-157 | Fort Bend County | 97.3 | 2.7 | 885.3 |
| 48-159 | Franklin County | 96.5 | 3.5 | 294.8 |
| 48-161 | Freestone County | 98.4 | 1.6 | 892.0 |
| 48-163 | Frio County | 99.9 | 0.1 | 1,134.3 |
| 48-165 | Gaines County | 100.0 | 0.0 | 1,502.8 |
| 48-167 | Galveston County | 43.4 | 56.6 | 873.8 |
| 48-169 | Garza County | 99.7 | 0.3 | 896.2 |
| 48-171 | Gillespie County | 99.7 | 0.3 | 1,061.7 |
| 48-173 | Glasscock County | 99.9 | 0.1 | 901.1 |
| 48-175 | Goliad County | 99.1 | 0.9 | 859.4 |
| 48-177 | Gonzales County | 99.7 | 0.3 | 1,069.8 |
| 48-179 | Gray County | 99.6 | 0.4 | 929.3 |
| 48-181 | Grayson County | 95.3 | 4.7 | 979.2 |
| 48-183 | Gregg County | 99.1 | 0.9 | 275.8 |
| 48-185 | Grimes County | 98.2 | 1.8 | 801.6 |
| 48-187 | Guadalupe County | 99.5 | 0.5 | 714.8 |
| 48-189 | Hale County | 100.0 | 0.0 | 1,004.8 |
| 48-191 | Hall County | 97.7 | 2.3 | 904.1 |
| 48-193 | Hamilton County | 99.9 | 0.1 | 836.4 |
| 48-195 | Hansford County | 99.9 | 0.1 | 920.4 |
| 48-197 | Hardeman County | 99.7 | 0.3 | 696.9 |
| 48-199 | Hardin County | 99.2 | 0.8 | 897.5 |
| 48-201 | Harris County | 95.9 | 4.1 | 1,777.4 |
| 48-203 | Harrison County | 98.3 | 1.7 | 915.7 |
| 48-205 | Hartley County | 99.9 | 0.1 | 1,463.1 |
| 48-207 | Haskell County | 99.2 | 0.8 | 910.3 |
| 48-209 | Hays County | 99.7 | 0.3 | 679.9 |
| 48-211 | Hemphill County | 99.4 | 0.6 | 912.2 |
| 48-213 | Henderson County | 92.1 | 7.9 | 948.4 |
| 48-215 | Hidalgo County | 99.2 | 0.8 | 1,582.9 |
| 48-217 | Hill County | 97.3 | 2.7 | 985.7 |
| 48-219 | Hockley County | 100.0 | 0.0 | 908.6 |
| 48-221 | Hood County | 96.3 | 3.7 | 436.8 |
| 48-223 | Hopkins County | 96.8 | 3.2 | 792.8 |
| 48-225 | Houston County | 99.5 | 0.5 | 1,236.6 |
| 48-227 | Howard County | 99.6 | 0.4 | 904.2 |
| 48-229 | Hudspeth County | 100.0 | 0.0 | 4,571.3 |
| 48-231 | Hunt County | 95.3 | 4.7 | 882.0 |
| 48-233 | Hutchinson County | 99.2 | 0.8 | 894.9 |
| 48-235 | Irion County | 100.0 | 0.0 | 1,051.6 |
| 48-237 | Jack County | 99.0 | 1.0 | 920.1 |
| 48-239 | Jackson County | 96.8 | 3.2 | 856.9 |
| 48-241 | Jasper County | 96.8 | 3.2 | 969.7 |
| 48-243 | Jeff Davis County | 100.0 | 0.0 | 2,264.6 |
| 48-245 | Jefferson County | 78.8 | 21.2 | 1,112.6 |
| 48-247 | Jim Hogg County | 100.0 | 0.0 | 1,136.2 |
| 48-249 | Jim Wells County | 99.6 | 0.4 | 868.5 |
| 48-251 | Johnson County | 98.7 | 1.3 | 734.4 |
| 48-253 | Jones County | 99.1 | 0.9 | 937.1 |
| 48-255 | Karnes County | 99.2 | 0.8 | 753.5 |
| 48-257 | Kaufman County | 96.7 | 3.3 | 807.6 |
| 48-259 | Kendall County | 99.9 | 0.1 | 663.0 |
| 48-261 | Kenedy County | 75.0 | 25.0 | 1,945.8 |
| 48-263 | Kent County | 100.0 | 0.0 | 902.9 |
| 48-265 | Kerr County | 99.6 | 0.4 | 1,107.3 |
| 48-267 | Kimble County | 100.0 | 0.0 | 1,251.2 |
| 48-269 | King County | 99.7 | 0.3 | 913.3 |
| 48-271 | Kinney County | 99.6 | 0.4 | 1,365.1 |
| 48-273 | Kleberg County | 80.8 | 19.2 | 1,090.2 |
| 48-275 | Knox County | 99.4 | 0.6 | 855.5 |
| 48-277 | Lamar County | 97.2 | 2.8 | 933.1 |
| 48-279 | Lamb County | 99.8 | 0.2 | 1,017.7 |
| 48-281 | Lampasas County | 99.8 | 0.2 | 713.9 |
| 48-283 | La Salle County | 99.5 | 0.5 | 1,494.2 |
| 48-285 | Lavaca County | 99.9 | 0.1 | 970.4 |
| 48-287 | Lee County | 99.2 | 0.8 | 634.1 |
| 48-289 | Leon County | 99.3 | 0.7 | 1,080.6 |
| 48-291 | Liberty County | 98.5 | 1.5 | 1,176.3 |
| 48-293 | Limestone County | 97.0 | 3.0 | 933.2 |
| 48-295 | Lipscomb County | 100.0 | 0.0 | 932.3 |
| 48-297 | Live Oak County | 96.4 | 3.6 | 1,078.9 |
| 48-299 | Llano County | 96.7 | 3.3 | 965.9 |
| 48-301 | Loving County | 98.9 | 1.1 | 676.5 |
| 48-303 | Lubbock County | 99.4 | 0.6 | 900.7 |
| 48-305 | Lynn County | 99.8 | 0.2 | 893.5 |
| 48-307 | McCulloch County | 99.3 | 0.7 | 1,073.4 |
| 48-309 | McLennan County | 97.8 | 2.2 | 1,060.2 |
| 48-311 | McMullen County | 98.5 | 1.5 | 1,156.8 |
| 48-313 | Madison County | 98.7 | 1.3 | 472.4 |
| 48-315 | Marion County | 90.6 | 9.4 | 420.3 |
| 48-317 | Martin County | 99.9 | 0.1 | 915.7 |
| 48-319 | Mason County | 99.6 | 0.4 | 932.2 |
| 48-321 | Matagorda County | 67.8 | 32.2 | 1,612.5 |
| 48-323 | Maverick County | 99.0 | 1.0 | 1,291.8 |
| 48-325 | Medina County | 99.3 | 0.7 | 1,334.5 |
| 48-327 | Menard County | 100.0 | 0.0 | 902.3 |
| 48-329 | Midland County | 99.8 | 0.2 | 902.0 |
| 48-331 | Milam County | 99.5 | 0.5 | 1,021.8 |
| 48-333 | Mills County | 99.8 | 0.2 | 749.8 |
| 48-335 | Mitchell County | 99.5 | 0.5 | 915.9 |
| 48-337 | Montague County | 99.2 | 0.8 | 938.3 |
| 48-339 | Montgomery County | 96.8 | 3.2 | 1,076.9 |
| 48-341 | Moore County | 98.9 | 1.1 | 909.6 |
| 48-343 | Morris County | 97.4 | 2.6 | 258.7 |
| 48-345 | Motley County | 100.0 | 0.0 | 989.8 |
| 48-347 | Nacogdoches County | 96.5 | 3.5 | 981.2 |
| 48-349 | Navarro County | 93.0 | 7.0 | 1,085.9 |
| 48-351 | Newton County | 99.4 | 0.6 | 939.7 |
| 48-353 | Nolan County | 99.8 | 0.2 | 913.9 |
| 48-355 | Nueces County | 71.9 | 28.1 | 1,165.4 |
| 48-357 | Ochiltree County | 99.9 | 0.1 | 918.2 |
| 48-359 | Oldham County | 99.9 | 0.1 | 1,501.4 |
| 48-361 | Orange County | 87.9 | 12.1 | 379.5 |
| 48-363 | Palo Pinto County | 96.7 | 3.3 | 985.5 |
| 48-365 | Panola County | 98.8 | 1.2 | 821.3 |
| 48-367 | Parker County | 99.3 | 0.7 | 910.1 |
| 48-369 | Parmer County | 99.5 | 0.5 | 885.2 |
| 48-371 | Pecos County | 100.0 | 0.0 | 4,764.8 |
| 48-373 | Polk County | 95.3 | 4.7 | 1,109.7 |
| 48-375 | Potter County | 98.5 | 1.5 | 922.0 |
| 48-377 | Presidio County | 100.0 | 0.0 | 3,855.9 |
| 48-379 | Rains County | 88.7 | 11.3 | 258.8 |
| 48-381 | Randall County | 98.9 | 1.1 | 922.4 |
| 48-383 | Reagan County | 99.9 | 0.1 | 1,176.0 |
| 48-385 | Real County | 99.9 | 0.1 | 700.1 |
| 48-387 | Red River County | 98.8 | 1.2 | 1,056.7 |
| 48-389 | Reeves County | 99.7 | 0.3 | 2,642.1 |
| 48-391 | Refugio County | 94.2 | 5.8 | 818.2 |
| 48-393 | Roberts County | 100.0 | 0.0 | 924.2 |
| 48-395 | Robertson County | 98.8 | 1.2 | 865.3 |
| 48-397 | Rockwall County | 85.4 | 14.6 | 148.8 |
| 48-399 | Runnels County | 99.4 | 0.6 | 1,057.1 |
| 48-401 | Rusk County | 98.5 | 1.5 | 938.4 |
| 48-403 | Sabine County | 85.3 | 14.7 | 576.6 |
| 48-405 | San Augustine County | 89.6 | 10.4 | 592.3 |
| 48-407 | San Jacinto County | 90.7 | 9.3 | 627.9 |
| 48-409 | San Patricio County | 98.0 | 2.0 | 707.9 |
| 48-411 | San Saba County | 99.7 | 0.3 | 1,138.4 |
| 48-413 | Schleicher County | 100.0 | 0.0 | 1,310.7 |
| 48-415 | Scurry County | 99.8 | 0.2 | 907.5 |
| 48-417 | Shackelford County | 99.9 | 0.1 | 915.5 |
| 48-419 | Shelby County | 95.3 | 4.7 | 834.6 |
| 48-421 | Sherman County | 100.0 | 0.0 | 923.2 |
| 48-423 | Smith County | 97.0 | 3.0 | 949.7 |
| 48-425 | Somervell County | 97.1 | 2.9 | 192.0 |
| 48-427 | Starr County | 99.5 | 0.5 | 1,229.1 |
| 48-429 | Stephens County | 97.3 | 2.7 | 921.5 |
| 48-431 | Sterling County | 100.0 | 0.0 | 923.5 |
| 48-433 | Stonewall County | 99.6 | 0.4 | 920.2 |
| 48-435 | Sutton County | 100.0 | 0.0 | 1,454.4 |
| 48-437 | Swisher County | 98.8 | 1.2 | 900.7 |
| 48-439 | Tarrant County | 95.7 | 4.3 | 902.3 |
| 48-441 | Taylor County | 99.6 | 0.4 | 919.3 |
| 48-443 | Terrell County | 100.0 | 0.0 | 2,358.0 |
| 48-445 | Terry County | 99.8 | 0.2 | 890.9 |
| 48-447 | Throckmorton County | 99.7 | 0.3 | 915.5 |
| 48-449 | Titus County | 95.4 | 4.6 | 425.6 |
| 48-451 | Tom Green County | 98.8 | 1.2 | 1,540.6 |
| 48-453 | Travis County | 97.0 | 3.0 | 1,023.0 |
| 48-455 | Trinity County | 97.2 | 2.8 | 714.0 |
| 48-457 | Tyler County | 98.8 | 1.2 | 935.6 |
| 48-459 | Upshur County | 98.4 | 1.6 | 592.6 |
| 48-461 | Upton County | 100.0 | 0.0 | 1,241.5 |
| 48-463 | Uvalde County | 99.6 | 0.4 | 1,558.6 |
| 48-465 | Val Verde County | 97.3 | 2.7 | 3,232.7 |
| 48-467 | Van Zandt County | 98.0 | 2.0 | 859.6 |
| 48-469 | Victoria County | 99.2 | 0.8 | 888.8 |
| 48-471 | Walker County | 97.8 | 2.2 | 801.5 |
| 48-473 | Waller County | 99.1 | 0.9 | 517.8 |
| 48-475 | Ward County | 100.0 | 0.0 | 835.8 |
| 48-477 | Washington County | 97.2 | 2.8 | 621.7 |
| 48-479 | Webb County | 99.6 | 0.4 | 3,375.6 |
| 48-481 | Wharton County | 99.2 | 0.8 | 1,094.4 |
| 48-483 | Wheeler County | 99.9 | 0.1 | 915.5 |
| 48-485 | Wichita County | 99.2 | 0.8 | 632.9 |
| 48-487 | Wilbarger County | 99.3 | 0.7 | 978.0 |
| 48-489 | Willacy County | 75.3 | 24.7 | 784.3 |
| 48-491 | Williamson County | 98.6 | 1.4 | 1,134.4 |
| 48-493 | Wilson County | 99.4 | 0.6 | 808.4 |
| 48-495 | Winkler County | 100.0 | 0.0 | 841.3 |
| 48-497 | Wise County | 98.0 | 2.0 | 922.6 |
| 48-499 | Wood County | 92.7 | 7.3 | 695.7 |
| 48-501 | Yoakum County | 100.0 | 0.0 | 799.7 |
| 48-503 | Young County | 98.2 | 1.8 | 930.9 |
| 48-505 | Zapata County | 94.4 | 5.6 | 1,058.0 |
| 48-507 | Zavala County | 99.7 | 0.3 | 1,301.7 |
Source: United States Census Bureau